
When creating a new Windows Form application, you’ll experience issues or bugs in your code. This is part of the normal development process, and you’ll need to debug your code to find the cause of any problems.
Visual Studio has many tools you can use to help you debug parts of your code. This includes adding breakpoints to certain lines of code and stepping through them line by line. This will help you to identify the values of variables at certain points.
You can also use the immediate window to print certain variables onto the command line.
How to Add Breakpoints to the C# File
Before running your application, you can add multiple breakpoints to certain lines of code, within the C# code-behind files. Once you run the application, the program will pause when it hits a breakpoint. You can then view a list of variables and all their values at that point.
- Create a new Windows Form application.
-
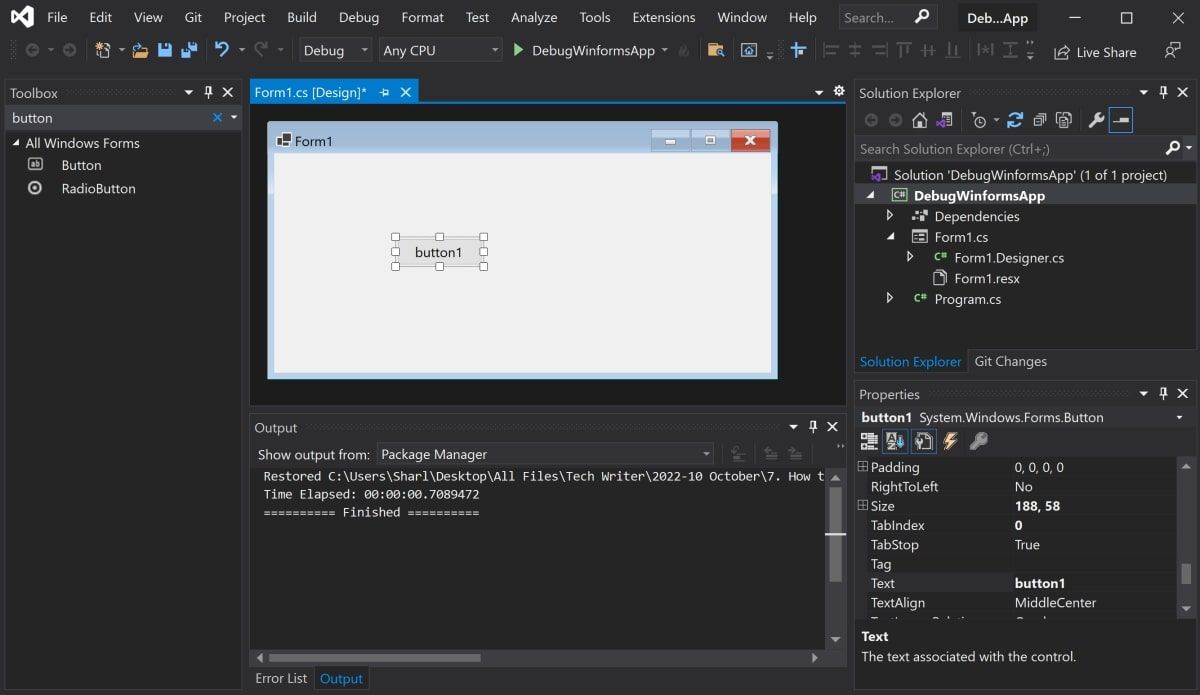
Search for a button using the Toolbox. Drag a new button from the Toolbox onto the canvas.
-
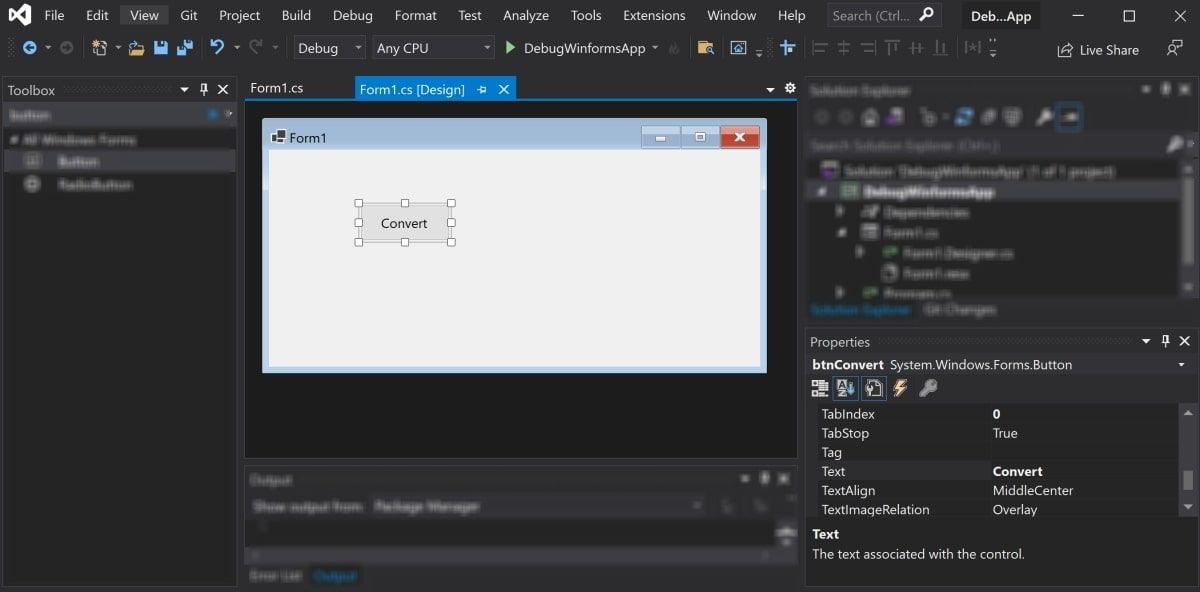
Highlight the button, and navigate to the properties window. Change its properties to the following new values:
Property
New Value
Name
btnConvert
Size
200, 80
Text
Convert
-
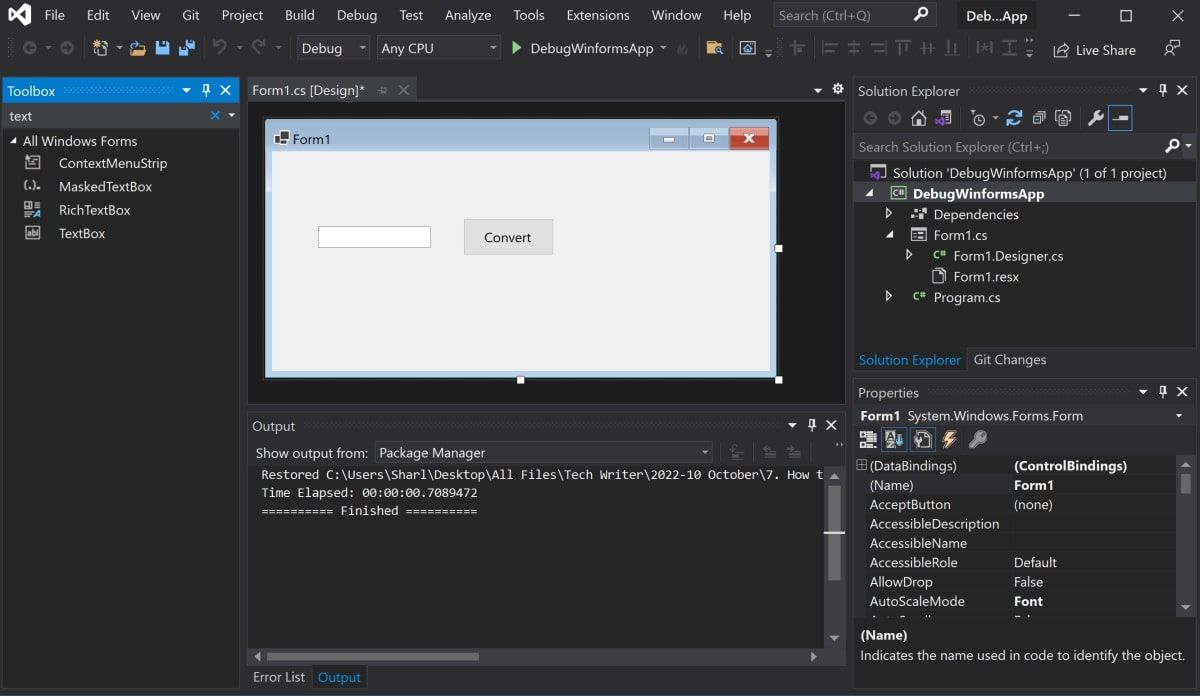
Click and drag a text box onto the canvas from the Toolbox. Place it to the left of the Convert button.
-
Highlight the new text box, and navigate to the properties window. Change its properties to the following new values:
Property
New Value
Property
New Value
Name
txtCelcius
-
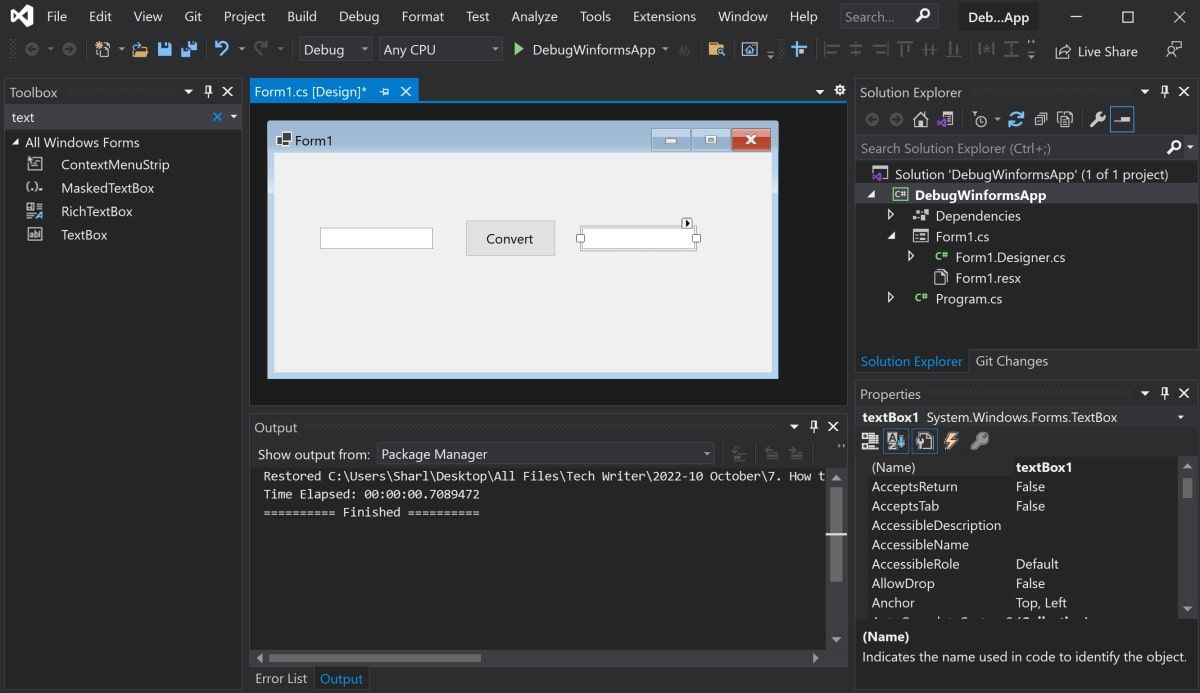
Click and drag another text box onto the canvas from the Toolbox. Place it to the right of the Convert button.
-
Highlight the new text box, and navigate to the properties window. Change its properties to the following:
Property
New Value
Name
txtFahrenheit
Enabled
False
-
On the canvas, double-click on the Convert button. This will generate a new function in the code-behind file, called btnConvert_Click(). Events in a Windows Form application can trigger certain functions to execute. For instance, this function will trigger when the user clicks on the Convert button at runtime.
        private void btnConvert_Click(object sender, EventArgs e)
{
} -
Add the following code in the function. This will get the value entered into the first text box, and use the CelciusToFahrenheit() function to convert it to Fahrenheit. It will then display the final result back to the user.
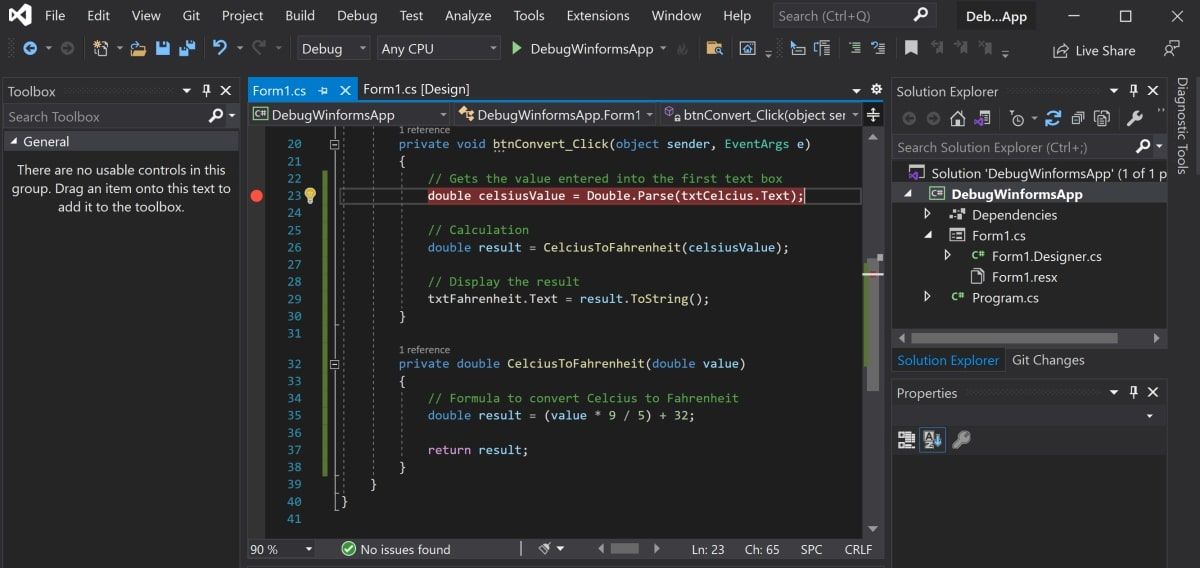
        private void btnConvert_Click(object sender, EventArgs e)
{
    // Gets the value entered into the first text box
    double celsiusValue = Double.Parse(txtCelcius.Text);

    // Calculation
    double result = CelciusToFahrenheit(celsiusValue);

    // Display the result
    txtFahrenheit.Text = result.ToString();
} -
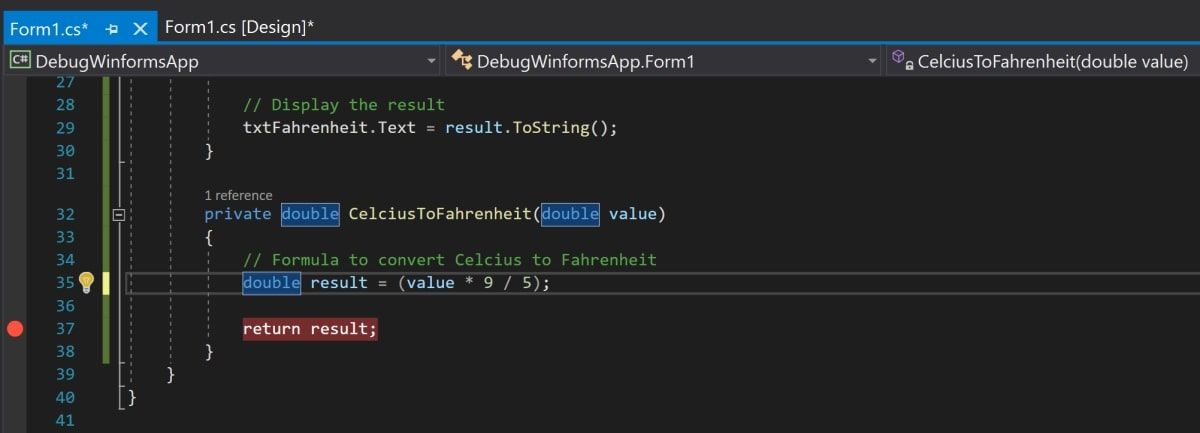
Create the CelciusToFahrenheit() function. This function will convert a number from Celsius to Fahrenheit, and return the result.
        private double CelciusToFahrenheit(double value)
{
    // Formula to convert Celcius to Fahrenheit
    double result = (value * 9 / 5) + 32;

    return result;
} -
Add a breakpoint for the first line of the btnConvert_Click() function. Add the breakpoint by clicking on the space located on the leftmost side of the code window.


How to Step Through the Functions and View Local Variable Values
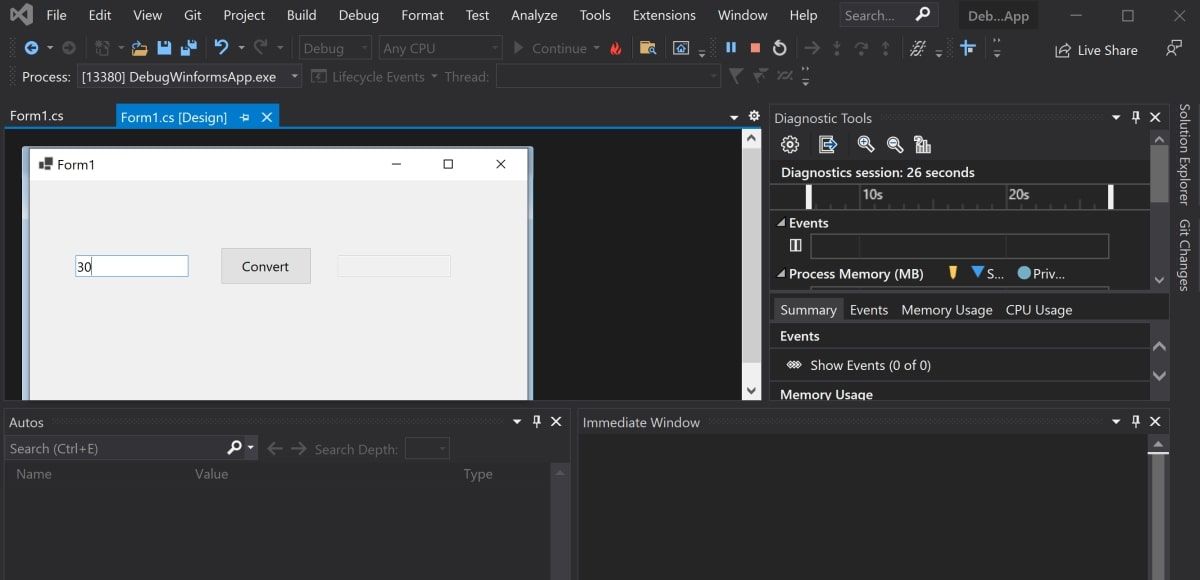
When you run your application, it will stop at the first breakpoint. You can use the Step Into, Step Over, or Step Out buttons to debug each line of the application.
-
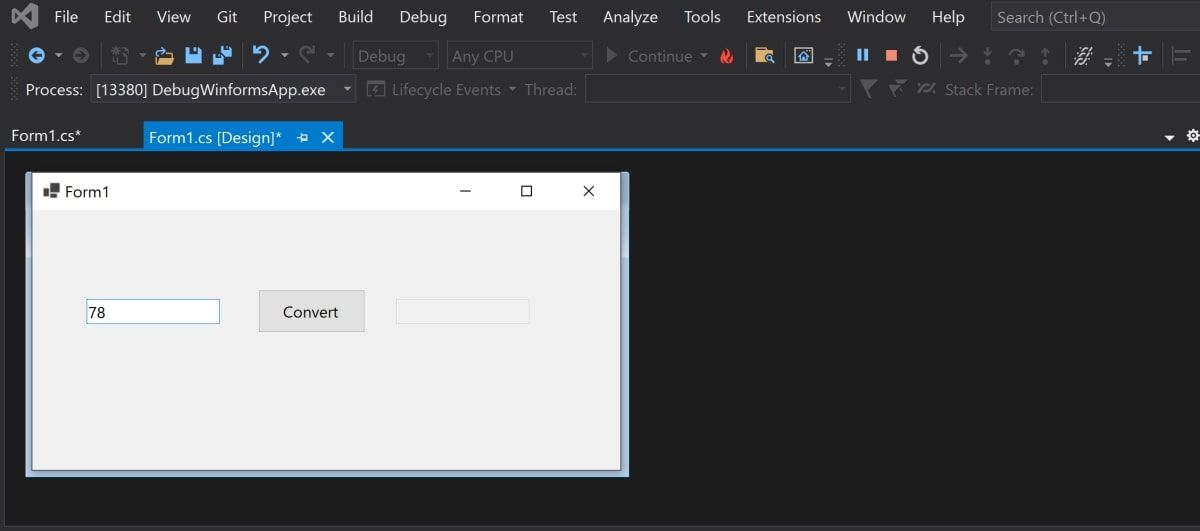
Click on the green play button at the top of the Visual Studio window.
-
Enter a number into the text box, and click on the Convert button.
-
The program will pause, and open the C# file where your breakpoint is. In this case, it will pause in the btnConvert_Click() function, as you triggered this function by clicking on Convert.
-
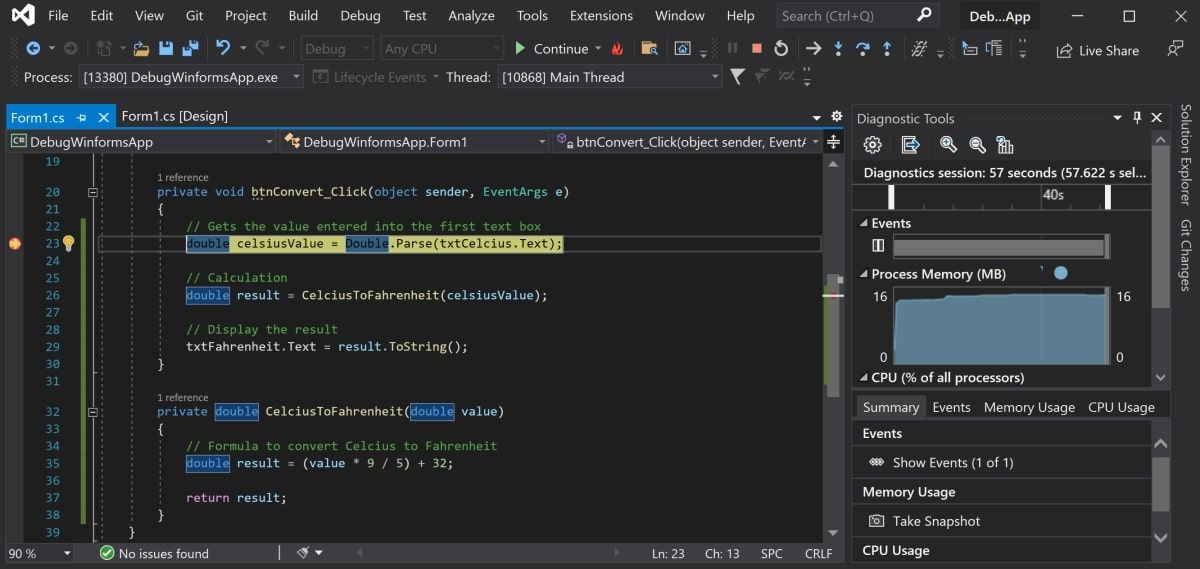
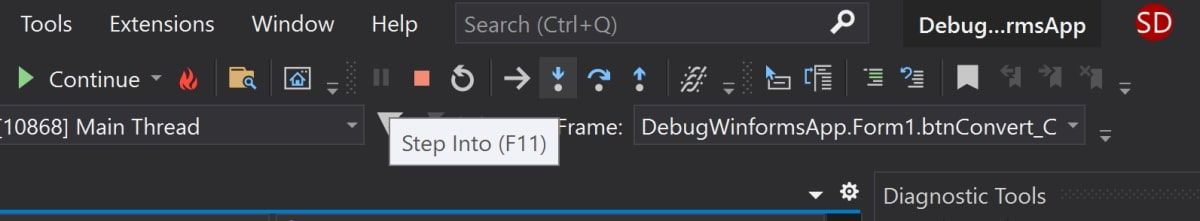
At the top of the Visual Studio window, you can use the Step Into (F11), Step Over (F10), and Step Out (Shift + F11) buttons to click through the program, line by line. This allows you to debug all variables and values for a highlighted line.
-
Click on the Step Over button to highlight the next line in the code.

-
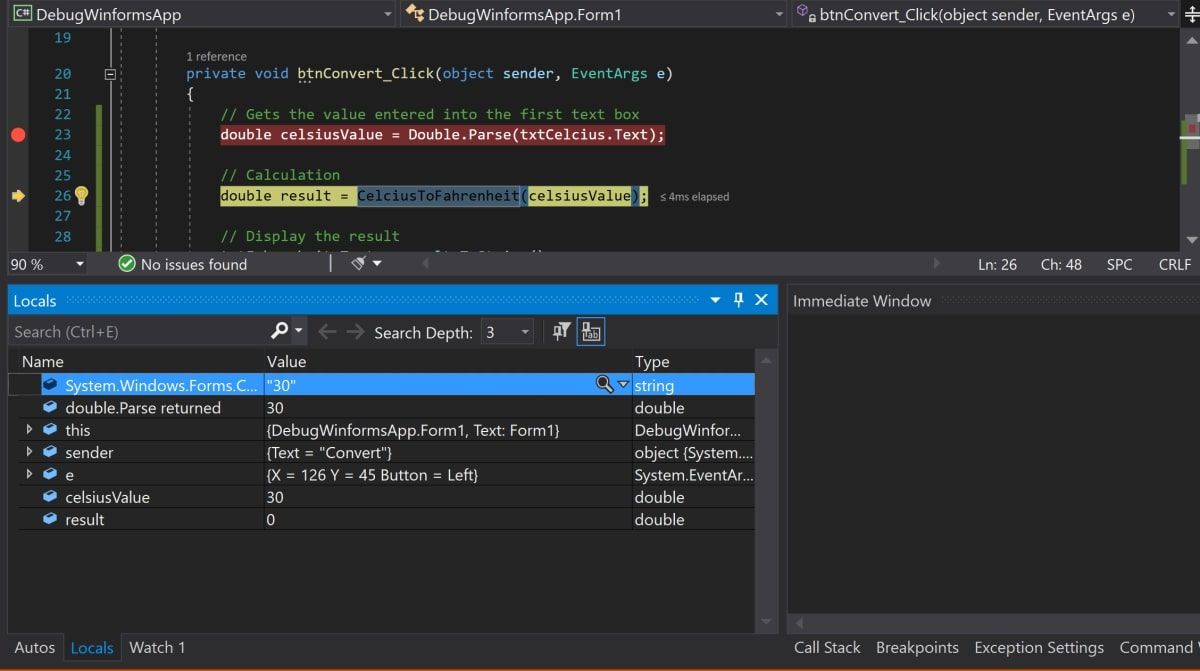
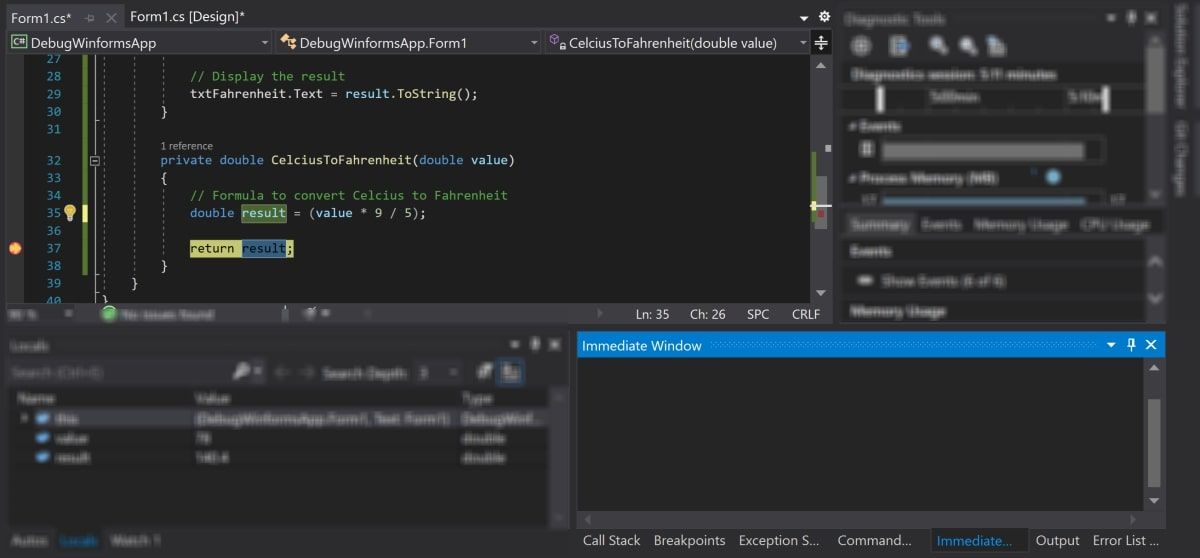
At the bottom of the Visual Studio application, click on the Locals tab. This allows you to view the values of all the variables at that point in the program.
-
The highlighted line now contains a call to the CelciusToFahrenheit() function. Click on the Step Into button to enter this function.
-
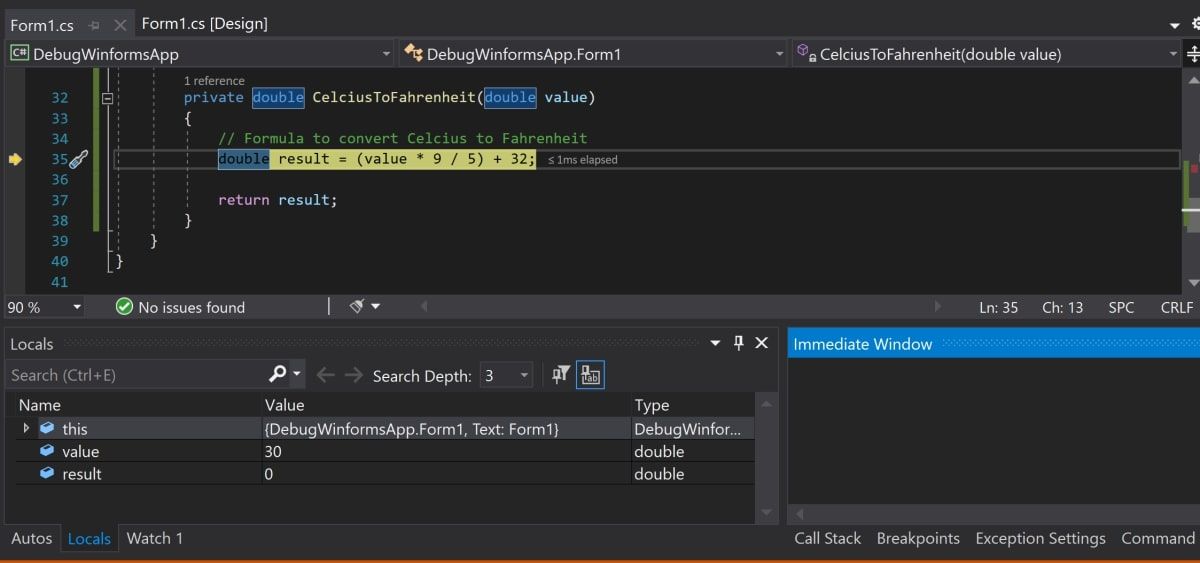
Click on the Step Out button to exit the CelciusToFahrenheit() function and go back to the btnConvert_Click() function.


How to View Values Using the Immediate Window
The immediate window tab allows you to print the values of any existing variables, and can be a very useful tool while debugging. You can also write one-line freestyle code, to experiment with getting different results and values.
-
Inside the CelciusToFahrenheit() function, modify the calculation. This will result in the wrong answer.
double result = value * 9 / 5; - Remove all existing breakpoints by clicking on them.
-
Add a new breakpoint in the CelciusToFahrenheit() function, at the point where you are returning the result.
-
With the application running, re-enter a number into the text box and click on the Convert button.
-
Once the program stops at your new breakpoint, click on the Immediate Window tab. You can find this at the bottom-right of the Visual Studio application.
-
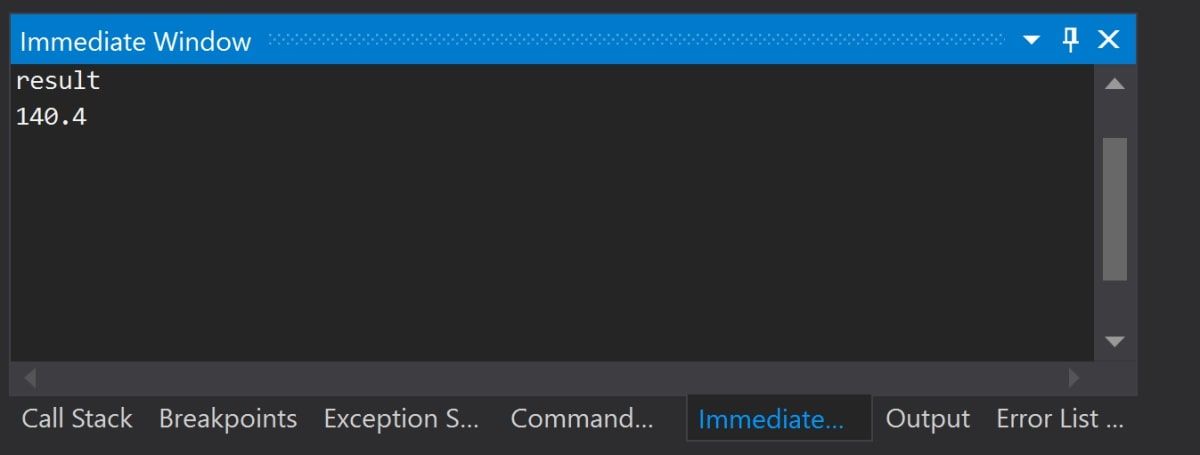
Type in the name of an existing variable, such as "result". Press Enter on your keyboard to print its current value at that point.
-
You can also type your own lines of code, pressing Enter on your keyboard after each line to view the result. Type in the following line of code into the immediate window tab, and press enter:
value * 9 / 5 -
In the immediate window, type in the correct calculation to see the correct result. Typing lines of code this way allows you to quickly and conveniently view new values, and to find what could be causing the issue. Here, you can see that the incorrect result is due to the incorrect calculation.
(value * 9 / 5) + 32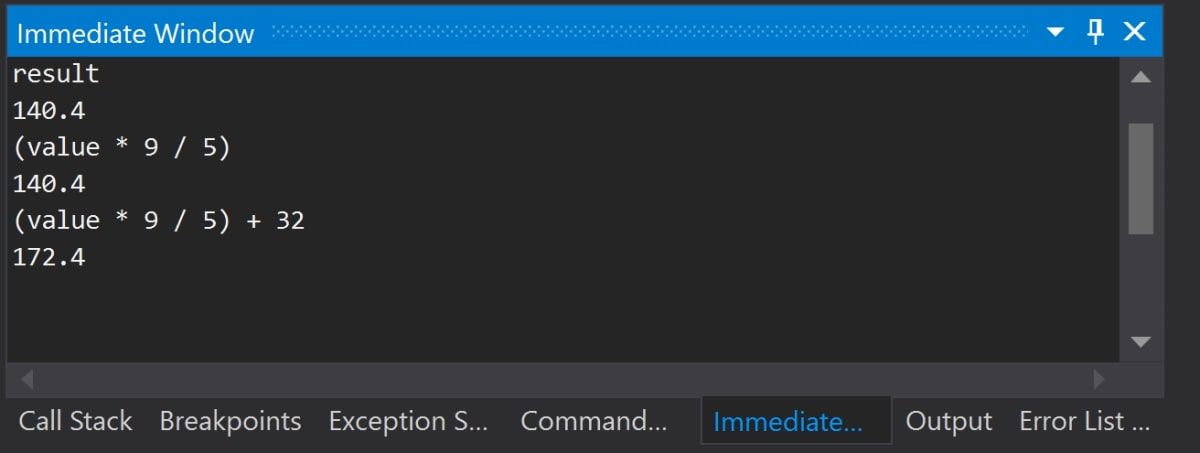


Debugging Winforms Applications to Investigate Errors
Hopefully, you now understand how to debug a Windows Form application. By using breakpoints, and stepping through each line, you should now be able to determine the root cause of any issues that may be occurring.
Now you can continue to maintain and keep any apps you build almost bug-free!