Ever heard of something called the Windows Event Viewer? It's an incredible tool that helps you analyze the event logs on your device. Simply put, the Event Viewer shows you detailed information about the processes that take place on your PC.
Now, let’s check out how you can use this tool to understand everything that’s happening on your PC. But first, let’s explore event logs a bit.
What Are Windows Event Logs?
Windows event logs refer to the pieces of information that record the activity on your device. These event logs provide you with information about the operating system and third-party software programs. They can even help you easily understand various Windows error messages.
For example, if you’re running into a problem, the event logs can help you understand where exactly the issue is coming from. That way, you can be able to get to the root of the issue and apply the relevant troubleshooting steps.
In other instances, event logs can show you the actions taken by your PC to troubleshoot certain errors. For example, if an issue got resolved mysteriously, you can track how the PC resolved it by analyzing event logs.
To view the event logs, you’d have to use the Windows Event Viewer.
How to Use the Windows Event Viewer to Analyze Event Logs
You can open the Event Viewer in various ways. The easiest way is to press Win + X and then select Event Viewer from the menu items.
Let’s now take a look at how this tool works.
Understanding the Event Viewer Interface
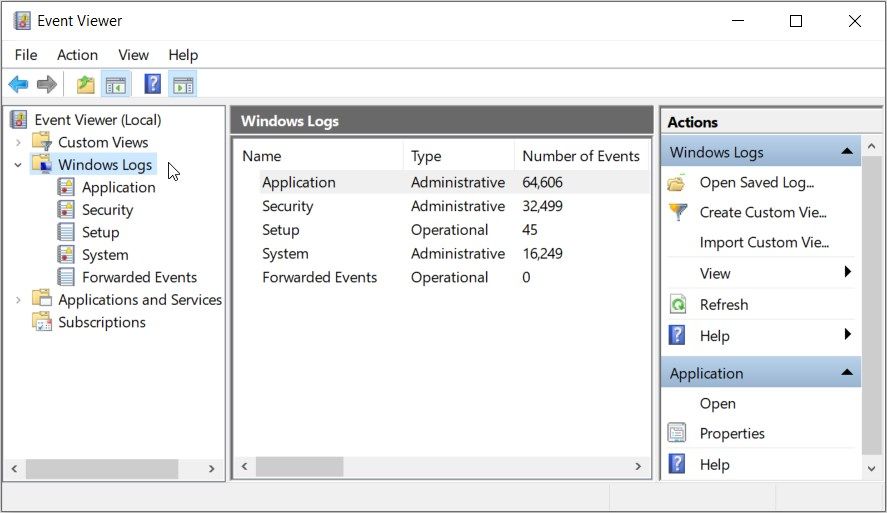
Once you’ve opened the Event Viewer, you should see the main menu towards the top-left corner. Now, click the Windows Logs drop-down menu.
Here’s a brief description of the options that appear below the Windows Logs menu:
- Application: Logs created by apps.
- Security: Logs associated with system security options.
- Setup: Logs created while installing or setting up Windows.
- System: Event logs created by the operating system.
- Forwarded Events: Logs forwarded to your PC by other computers.
Below the Windows Logs drop-down menu, you should see the Applications and Services Logs drop-down menu. This menu contains options that help you view and analyze event logs for Windows PowerShell and other services.
In this article, we’ll only take a detailed look at the System option under the Windows Logs drop-down menu. Once you’re familiar with handling event logs for this folder, everything else should be fairly simple.
Viewing and Understanding Log Details
Now that you’re familiar with the Event Viewer interface, let’s get started.
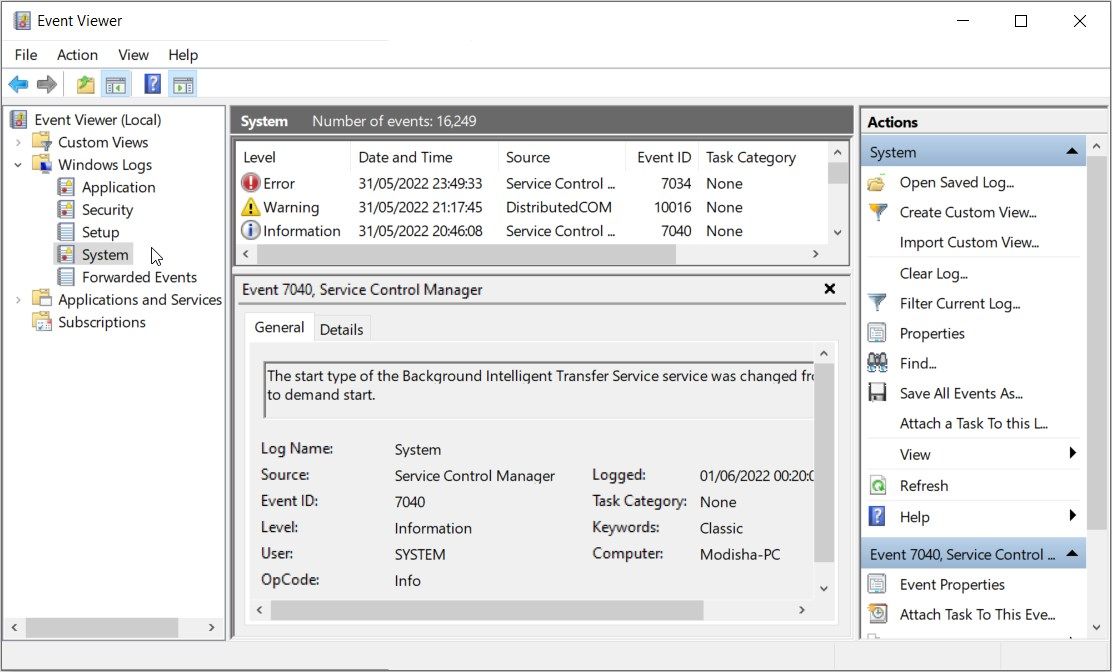
Click on the Windows Logs drop-down menu and select the System option. Now, let’s explore all the information displayed in the middle pane.
On the top part of the middle pane, you should see these five options: Level, Date and Time, Source, Event ID, and Task Category.
- Event ID: This is the identification number for each specific event.
- Task Category: Shows the category names for each event log.
- Source: This is the name of the application or process that triggers the event log.
- Date and Time: This option shows the date and time on which the event log information was saved.
The Level option shows the status of a particular task. Here are the options that you’d usually see below this option:
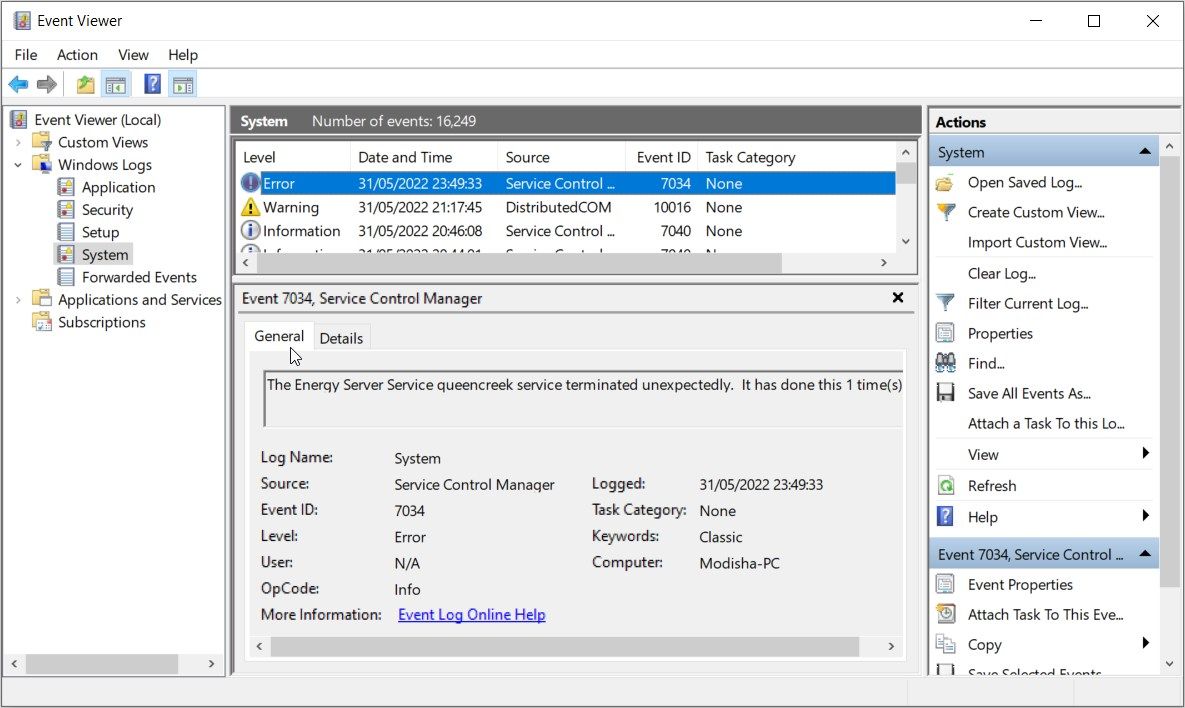
- Information: This is displayed when a task is successfully completed.
- Warning: This is displayed on a task that’s likely to run into issues.
- Error: Shows you details about a particular task that encountered issues.
- Critical: This message is displayed on a task that has encountered critical issues.
To understand each Level display message in detail, click on a specific task and check the information displayed in the General tab (on the bottom part of the middle pane).
To display more details about a log event, click the Details tab next to the General tab.
Now, the bottom part of the middle pane displays all the event log information in one place. This includes the Level, Date and Time, Source, Event ID, and Task Category options that we've discussed.
Here are some of the additional options that appear in this pane:
- Log Name: This refers to the name of the category found in the Windows Logs drop-down menu. For example, if you’re viewing System logs within the Windows Logs menu, the Log Name displayed will be “System.”
- User: This refers to the name of the user that logged in to the device when the event was recorded. In most cases, this option displays “SYSTEM.”
- OpCode: This shows the type of task performed when recording a log event. For example, if you’re viewing a log for a particular file that was recently installed, the option will display “Installation.”
- Logged: This shows the date and time on which the event occurred.
- Keywords: This displays the keyword related to a specific event. For example, if you’re viewing a log about an app that was successfully installed, the keywords displayed could be “Success, Installation.”
- Computer: This shows the name of the computer where the event took place.
- More Information: This option contains a link that you can click in case you need further help while analyzing logs.
Finding and Filtering Event Logs
The Event Viewer also makes it easy for you to find and filter specific logs. You can do all this using the Actions pane on the right-hand side.
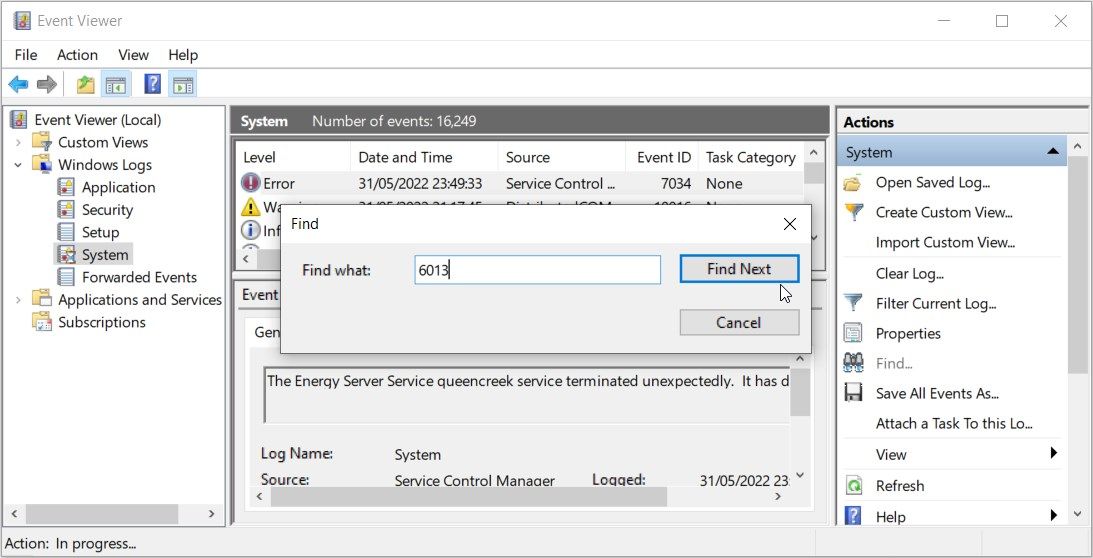
To search for an event log, click the Find button on the Actions pane. From there, search for an event log using the Source name, Event ID, or Task Category.
For example, if you’re looking for a specific task with an Event ID of 6013, type 6013 in the Find what box and click Find Next. This should highlight your task in the middle pane.
If you have several tasks with the same Event ID, this should display the first result. To navigate to the other options, keep clicking the Find Next button until you locate your task.
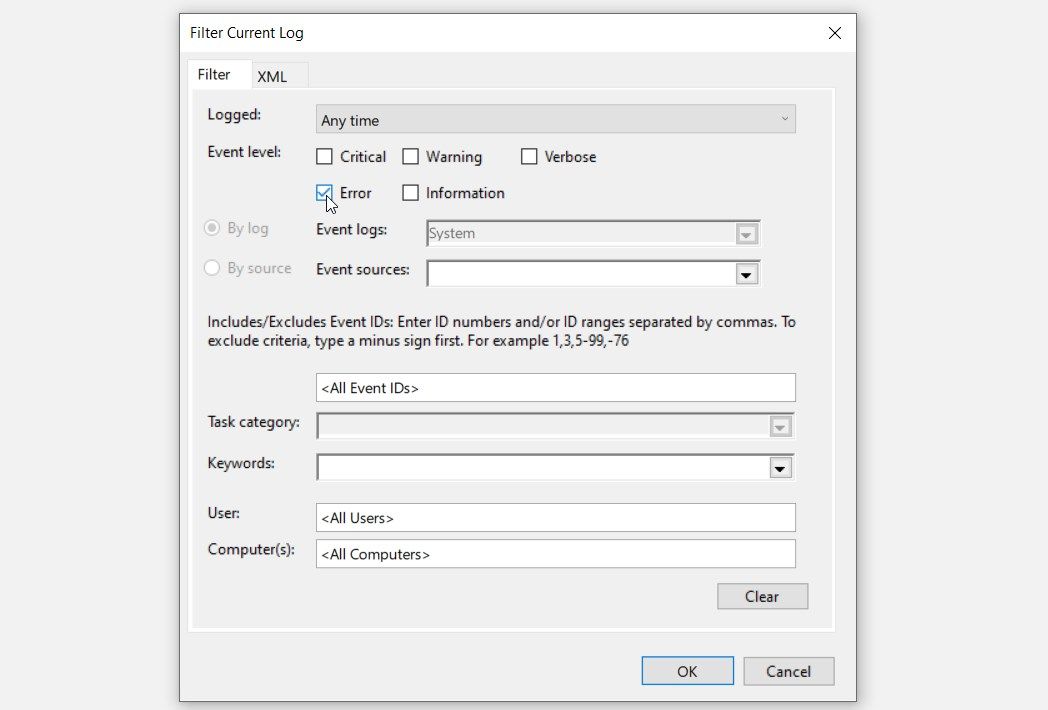
You can also filter your log events according to Date and Time, Level, Task Category, Source, Keywords, User, and Computer. As an example, let’s check out how you can filter your event logs based on the Level option:
- Click the Filter Current Log option on the Actions pane.
- Tick one of the boxes next to the Event level option. For example, check the Error box and then click OK. This should only display event logs whose status is shown as “Error.”
You can also perform other actions by selecting the relevant options on the Actions pane. For example, you can save, copy, and clear event logs.
If you want to view and analyze Windows event logs on a remote device, right-click on the Event Viewer (Local) option in the top-left corner of the screen. From there, select the Connect to Another Computer option.
Easily Analyze PC Processes With the Event Viewer
Just like any other Windows device, your PC might run into issues from time to time. And if you really want to understand what’s causing those issues, try using the Windows Event Viewer.
Wondering how to get started with using this tool? The tips we’ve covered are all you’ll need. And once you get to the root of the problem, you'd have to use the relevant PC troubleshooters.


