Microsoft Excel is a program that uses spreadsheets to help you organize numbers and data with functions and formulas. There are many different ways you can use Excel, and with so many ideas, it is easy to get disorganized.
With that said, there is always a way to find a workaround that will help you get your spreadsheets in order. This is especially useful for team projects in Excel.
1. Use Templates
You should not waste your time trying to recreate Excel spreadsheets from scratch every time you want to analyze your data. Instead, Microsoft Excel already includes a wide range of user-made templates.
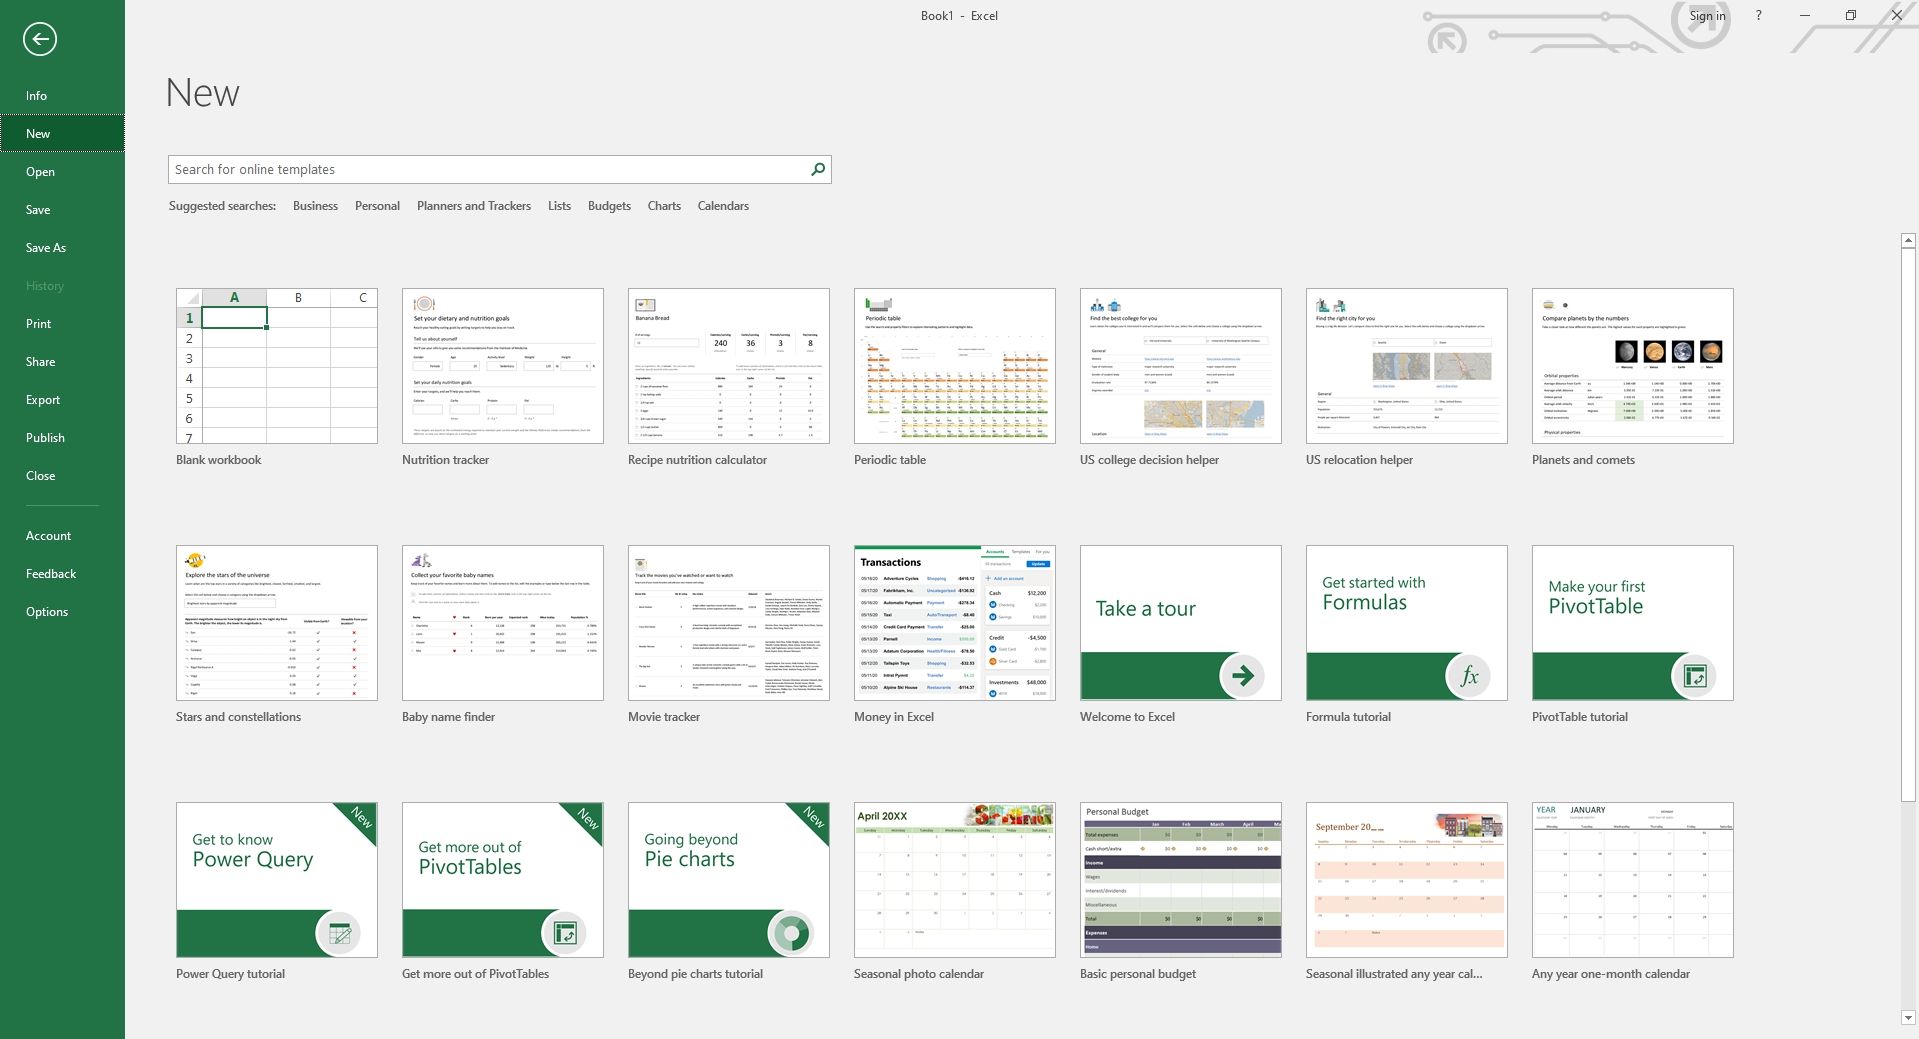
Simply click on File > New and choose one of the many templates that come with Excel. Of course, you might have difficulty finding a template that perfectly suits your data analysis process.
But, you can still find one, which you can easily format to make it look better and more functional.
2. Highlight the Important Data
As with any management tool, you should always highlight the most important information. The same applies when you are working in Excel, especially if you have a whole team working in a single spreadsheet.
One of the easiest ways you can do this is to create a dashboard sheet where your key data points will be summarized.
In addition, you should always keep your key information in an easy-to-read font while using conditional formatting in order to assign the heights and color to important cells.
These are simple presentation tactics that are going to make your organizational data analysis go much smoother.
3. Sort Your Data
One of the integral parts of data analysis is knowing how to sort your data. No matter whether you want to sort the names alphabetically or list the products from lowest to the highest price, it doesn't matter how you do it.
Sorting your data will help you quickly understand and visualize your data better. Excel allows you to sort your data alphabetically, numerically, and by date and time. You can also choose to sort it by a custom list that you create, or by formatting, font color, icon set, or by including cell color.
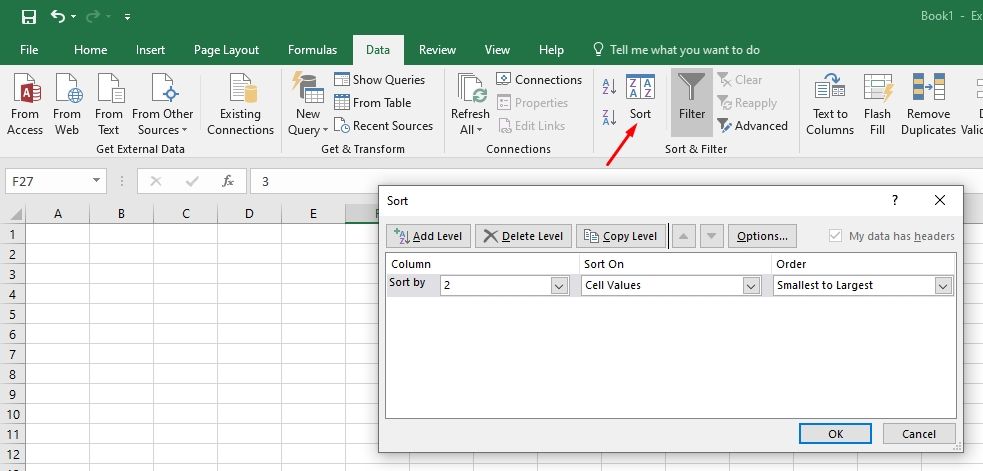
After selecting the columns or rows that you want to sort, simply click on Sort & Filter in the Data tab and be given more options to sort your data. If you have any issues with this, you can check out the tutorial on Microsoft’s official website.
4. Use Multiple Sheets!
When you are working on something complex or working with a lot of information overall, do not forget that Excel allows you to simultaneously use many spreadsheets.
You do not have to store all your information on a single spreadsheet. Instead, spread your data across multiple spreadsheets and label it accordingly. This will allow you to find all the info that you need easily.
5. Hide Unnecessary Data
When you have too much information in a spreadsheet, it is difficult to focus on the right things. If you find yourself getting lost in numbers, maybe it is time to review your spreadsheets, component by component.
If you find any type of information that doesn't seem necessary or important anymore, you can hide it. Excel has a feature that lets you hide columns, sheets, or rows that you no longer require, but don't want to delete.
Data visualization tools are usually capable of hiding information such as assumptions numbers and lookup tables that make up the basis of your models but do not change.
6. Hyperlinked Cells Can Save You a Lot of Time
When working in a team, or even alone, more often than not, you will waste time searching for a certain piece of information, by going through all the spreadsheets.
But, it does not have to be that way. Instead, you can name your important cells and hyperlink them within your sheets, which will guide you through the data. Microsoft Excel has great navigation tools for your data analysis, so make sure to utilize that.
7. Use Formulas and Functions Correctly
Mastering the basics of Excel formulas is critical for all beginners. Microsoft Excel is considered as the software for data analysis, across most industry standards.
It also happens to be the most preferred software for financial analysts, investment bankers, presentations, and financial modeling. Excel has built-in functions and formulas that are designed to make your life easier.
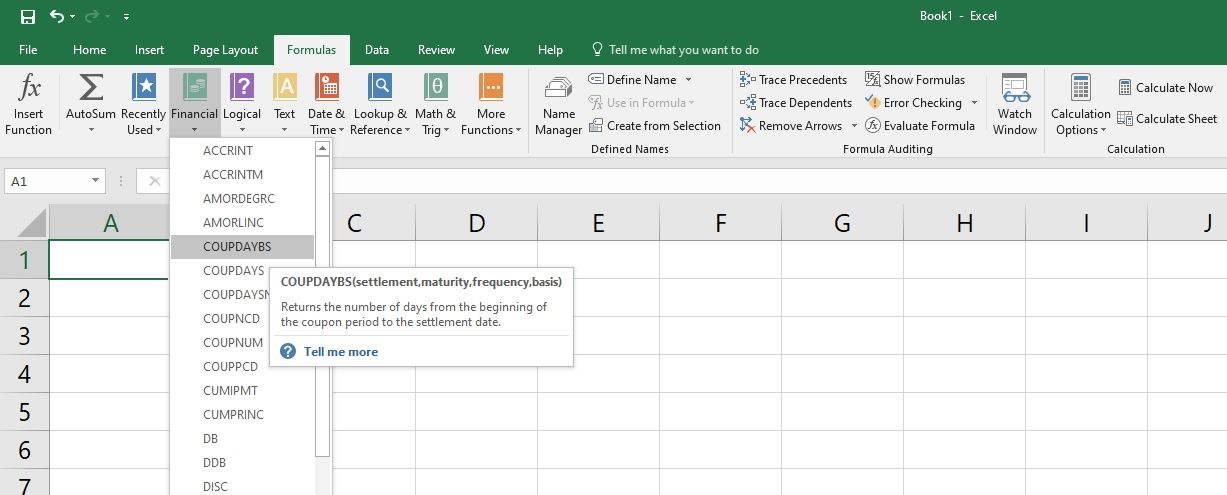
A formula in Excel is an expression that will operate on a value in a cell or in a range of cells. A function is a predefined formula. They eliminate the need to always input formulas while providing human-friendly names.
8. Shortcuts Can Help You Work Faster
Once you are already used to Excel functions and formulas, you should learn the basic shortcuts. You might find that by using keyboard shortcuts for Excel, you will be able to work a lot more efficiently.
This especially applies to users with mobility or vision disabilities. Keyboard shortcuts are an easier way to get the results you want from Excel without tapping on a touchscreen or using a mouse.
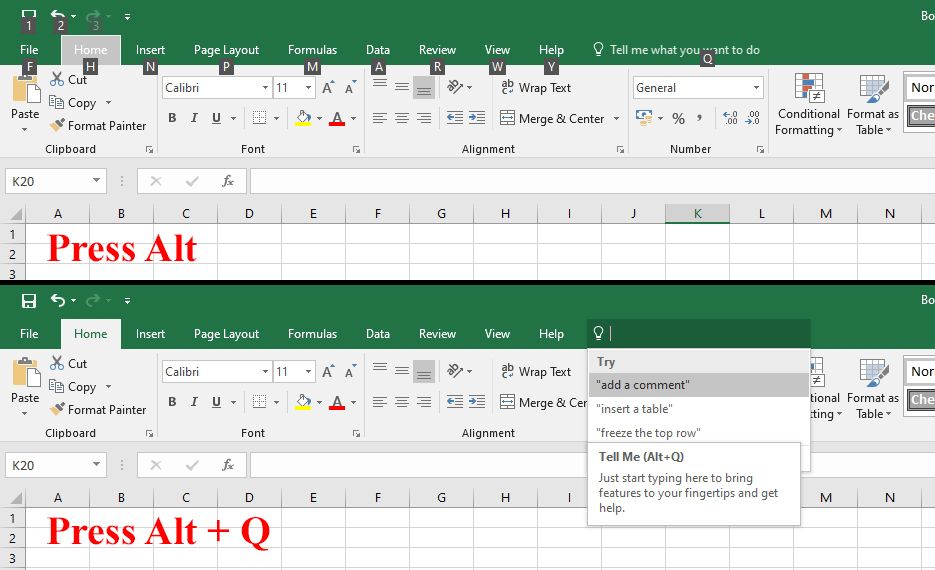
By simply pressing Alt in Excel, you will get to see all the shortcuts on top, and if you press Alt + Q, you will be redirected to the search box. The search box is a nice feature Microsoft added to their programs, as it allows you to find something easily. You can also create custom keyboard shortcuts in Excel.
Make Your Life Easier With Organized Spreadsheets
There is a good rule to live by when talking about Microsoft Excel. If you catch yourself doing something manually in Excel, you should know that there is probably an easier way to go about it.
Microsoft Excel is commonly used in workplaces around the globe. With every new update, it becomes easier to use, but it can also be a lot more complicated. Knowing the basics of Excel functions and formulas, as well as how to keep your spreadsheets organized, will help you completely utilize the program.

