Ever looked at your Excel data and wondered what if some cells had different values? How would that affect the final outcome? Wonder no more. Excel's Scenario Manager is here to answer exactly that question.
Scenario Manager is a useful feature in Excel that allows you to quickly switch between different sets of values for one or more cells. This lets you compare different scenarios and outcomes without changing the original data.
This feature can save you lots of time and effort in Excel, as you won't have to rebuild the same table with new data. Read on to learn everything there is to know about Scenario Manager in Excel.
What Are Scenarios in Excel?
Scenarios are alternative sets of data that you can save and quickly switch between. You can create and use scenarios through Scenario Manager, which is a part of Excel's What-If Analysis tools. These scenarios can be different sales figures, interest rates, exchange rates, or whatever you have in mind. Excel scenarios only include the changing cells you specify in them, but they can alter any cell in your spreadsheet.
A scenario's core is its changing cells. These cells contain the data that changes between different scenarios. This concept is a bit confusing, as not every cell that changes is considered a changing cell for your scenario. For instance, formulas change based on their input. When the input of a formula changes, the formula results change as well.
Thus, you need only specify the input cells with static values as changing cells for your scenario. The formula cells will change accordingly when you switch scenarios. With that in mind, you're ready to create and use scenarios in Excel. Let's get to it!
How to Create Scenarios in Excel
Creating a scenario in Excel is rather straightforward. An Excel scenario consists of a scenario name, the changing cells, and their cell values.

Let's kick this off with an all-around example. In this spreadsheet, we have the costs and profit of producing and selling a product. But what if you made the product more premium? Sure, it would cost more to produce, but you could instead sell it for a higher price. Would doing this give more profit? That's a question for the Scenario Manager to answer.
For this example, let's define three scenarios. A basic product like the current one, a premium product and a luxury product. You can use Scenario Manager to see which one of these products yields more profit.
As mentioned before, dynamic cells such as formula cells, will change automatically without being included in the scenario. In this spreadsheet, Total Production Cost, Revenue, and Net Profit are automatically calculated through formulas, so we won't include them in the scenario as changing cells.
One other thing to note is that the shipping price remains the same regardless of the product's quality. Thus, we'll exclude the shipping price from the scenario as a changing cell.
- Select the cells that you want to change in different scenarios. In this example that's B1:B3, B6, B7, and B9.
- Go to the Data tab and click on What-If Analysis in the Forecast group.
-
Select Scenario Manager from the drop-down menu.
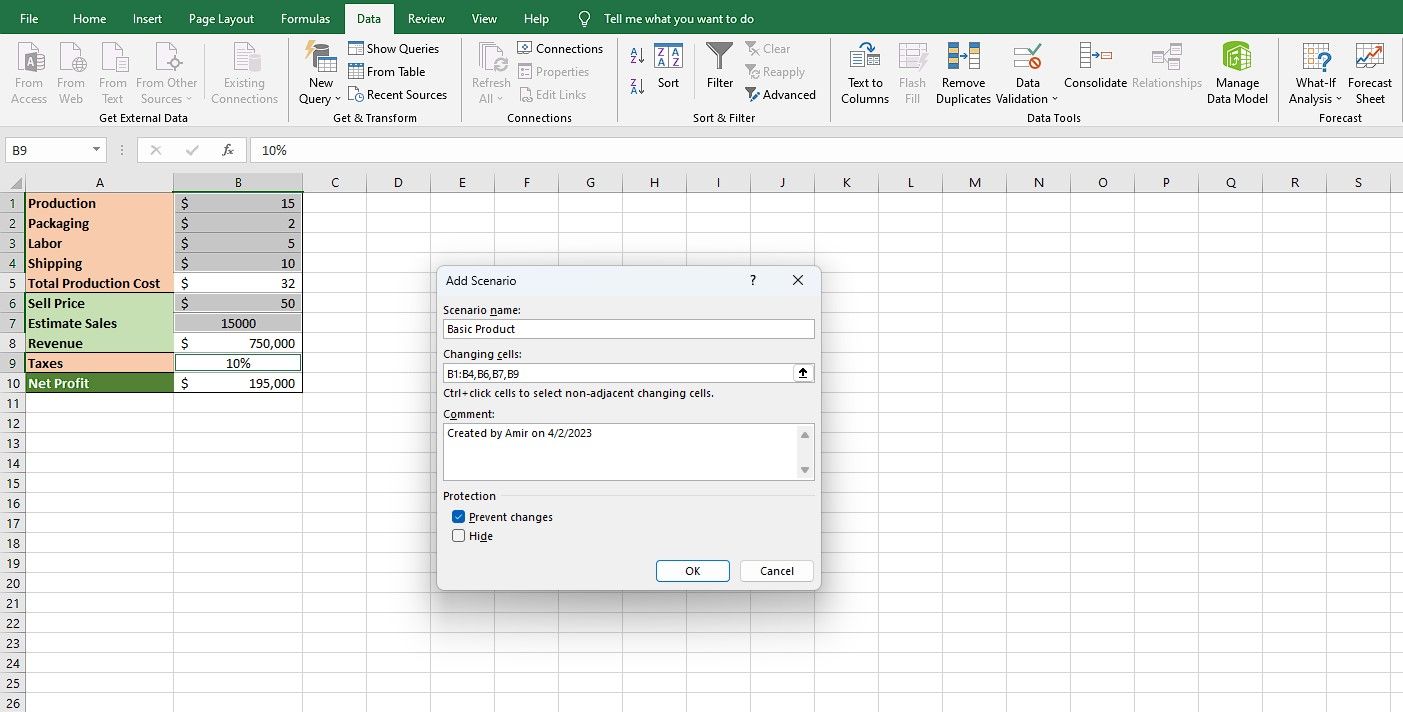
- In the Scenario Manager dialog box, click on Add to create a new scenario.
- Give your scenario a name. We're going to name this one Basic Product.
-
Click OK. This will open a new window.
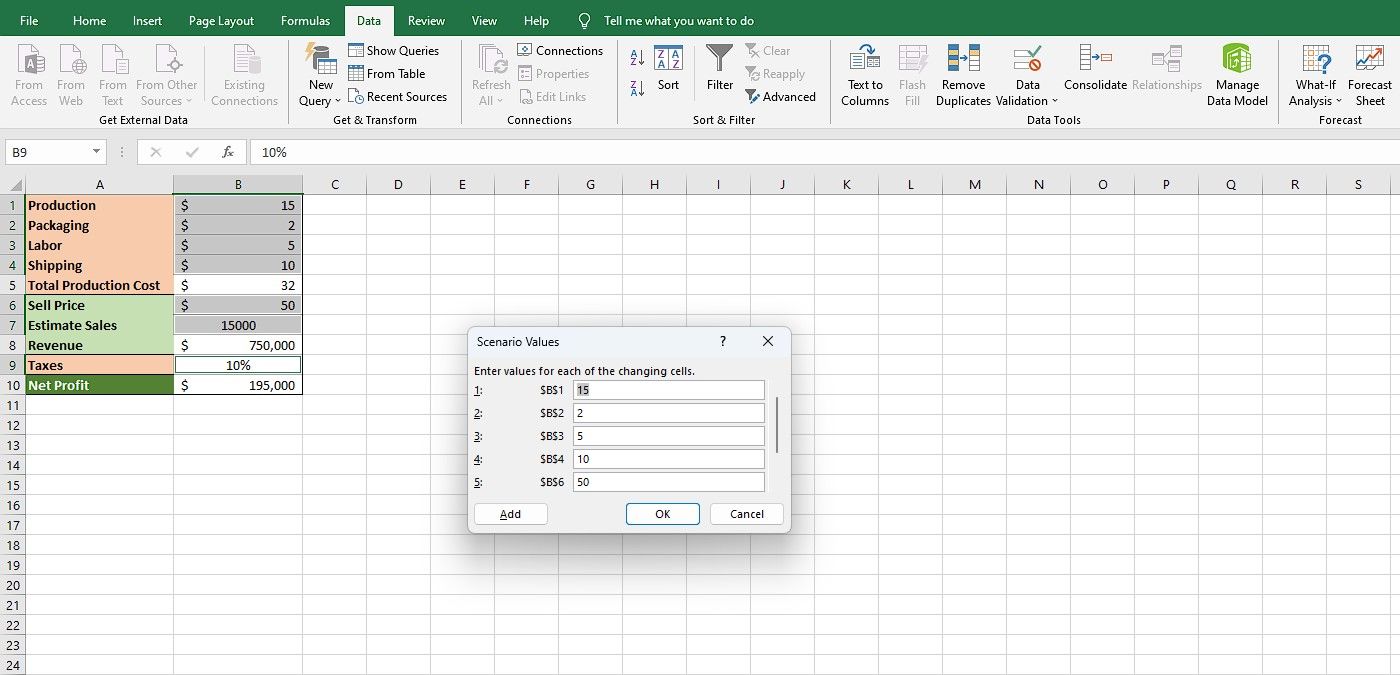
- In the Scenario Values window, enter the values that you want for the selected cells in this scenario. If you want to save the current values as a scenario, leave them unchanged.
- Click OK when you're done.


Now that you have created the first one down, repeat the steps and add the other scenarios.

Once your scenarios are ready, double-click on a scenario's name in Scenario Manager to see it in the spreadsheet. Note that the formula values change as well.
How to Summarize Scenarios in Excel
Switching values with a simple double-click is already a major upgrade from having to recreate the data table entirely. But it's still not very convenient for comparing all the scenarios at once.

Once you have created and saved your scenarios, you can use the Summary feature to quickly compare and analyze all scenarios.
- Go to the Data tab and click on What-If Analysis in the Forecast group.
- Select Scenario Manager from the drop-down menu.
- In Scenario Manager, click on Summary.
- Check that the Result cells is correctly set. In this example, that's B10.
- Click OK.
Excel will now create a new sheet containing a table of all scenarios in the same document. Now you can quickly compare the costs and profits of each product. In our case, the Luxury Product seems to yield more profit, despite the higher production cost and taxes.

The downside of the Summary Report is that it doesn't get the value labels from the adjacent cells. This is an inconvenience, but you can manually enter the labels in the report. Being able to manually enter the labels hints at another downside: The Summary Report is not dynamic. So when you change scenarios, you'll have to generate a new report.
Despite all that, the Summary Report is still a valuable tool. Since the scenarios are organized in a table, you can also graph your data in Excel charts to analyze them visually. Alternatively, you can also summarize the scenarios as a pivot table in Excel for further analysis.
Quickly Swap Values With Scenario Manager in Excel
Manual data entry is already a chore as it is, so manually recreating a table for different scenarios can be time-consuming and frustrating. Fortunately, Excel's Scenario Manager can soothe your pain in that regard.
Now that you know how to use Scenario Manager, you can turn your Excel spreadsheets into dynamic tools that allow you to quickly switch between different scenarios. With just a few clicks of the mouse, you can make changes to large amounts of data in a fraction of the time.
You can also generate a summary report of all scenarios to better analyze and visualize them. Utilizing the Scenario Manager in Excel will help you to maximize your data analysis efficiency, especially when you combine it with other tools, such as the pivot table.