Are you trying to capture data packets in order to analyze traffic on your network? Maybe you are a server administrator who has bumped into an issue and wants to monitor transmitted data on the network. Whatever the situation be, the tcpdump Linux utility is what you need.
In this article, we will discuss the tcpdump command in detail, along with some guides on how to install and use tcpdump on your Linux system.
What Is the tcpdump Command?
Tcpdump is a powerful network monitoring tool that allows a user to filter packets and traffic on a network efficiently. You can get detailed information related to TCP/IP and the packets transmitted on your network. Tcpdump is a command-line utility, which means you can run it on Linux servers without a display.
System administrators can also integrate the tcpdump utility with cron in order to automate various tasks such as logging. Since its numerous features make it quite versatile, tcpdump works as as a troubleshooting as well as a security tool.
How To Install tcpdump on Linux
While most of the time you will find tcpdump preinstalled on your system, some Linux distributions do not ship with the package. Therefore, you may have to manually install the utility on your system.
You can check if tcpdump is installed on your system by using the which command.
which tcpdump
If the output displays a directory path (/usr/bin/tcpdump), then your system has the package installed. However if not, you can do it easily using the default package manager on your system.
To install tcpdump on Debian-based distributions such as Ubuntu:
sudo apt-get install tcpdump
Installing tcpdump on CentOS is easy as well.
sudo yum install tcpdump
On Arch-based distributions:
sudo pacman -S tcpdump
To install on Fedora:
sudo dnf install tcpdump
Note that the tcpdump package requires libcap as a dependency, so make sure you install it on your system as well.
Tcpdump Examples to Capture Network Packets on Linux
Now that you have successfully installed tcpdump on your Linux machine, it is time to monitor some packets. Since tcpdump requires superuser permissions to execute most of the operations, you will have to add sudo to your commands.
1. List All Network Interfaces
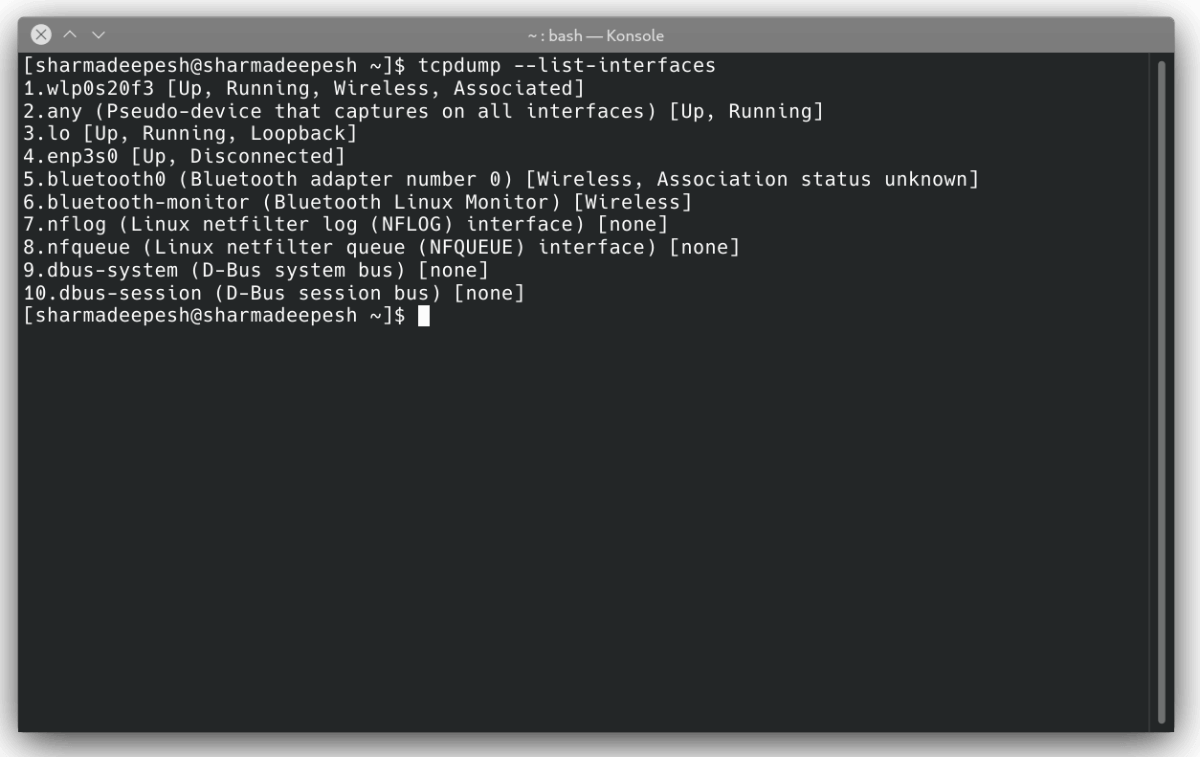
To check which network interfaces are available to capture, use the -D flag with the tcpdump command.
tcpdump -D
Passing the --list-interfaces flag as an argument will return the same output.
tcpdump --list-interfaces
The output will be a list of all the network interfaces that are present on your system.
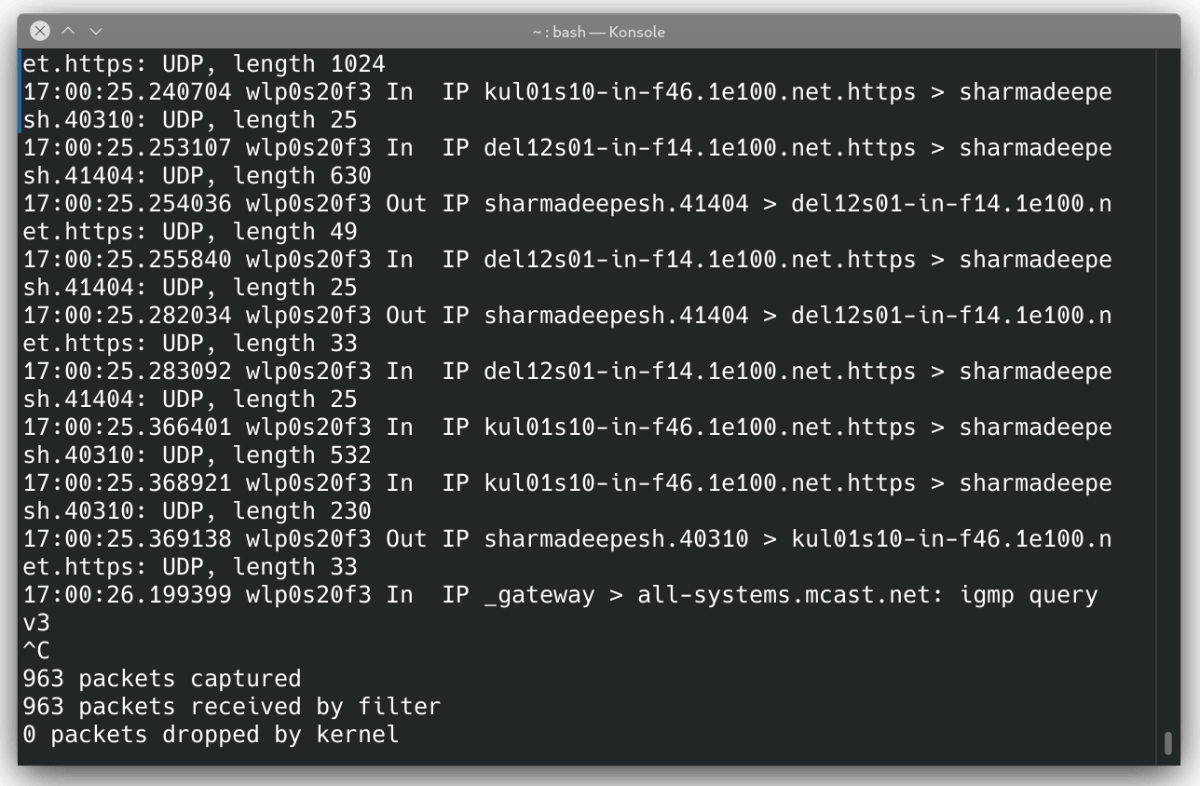
After getting the list of network interfaces, it is time to monitor your network by capturing packets on your system. Although you can specify which interface you want to use, the any argument commands tcpdump to capture network packets using any active interface.
tcpdump --interface any
The system will display the following output.
2. The tcpdump Output Format
Starting from the third line, each line of the output denotes a specific packet captured by tcpdump. Here's what the output of a single packet looks like.
17:00:25.369138 wlp0s20f3 Out IP localsystem.40310 > kul01s10-in-f46.1e100.net.https: Flags [P.], seq 196:568, ack 1, win 309, options [nop,nop,TS val 117964079 ecr 816509256], length 33
Keep in mind that not all packets are captured this way, but this is the general format followed by most of them.
The output contains the following information.
- Timestamp of the received packet
- Interface name
- Packet flow
- Name of the network protocol
- IP address and port details
- TCP flags
- The sequence number of data in the packet
- Ack data
- Window size
- Packet length
The first field (17:00:25.369138) displays the time stamp when your system sent or received the packet. The time recorded is extracted from your system's local time.
The second and third fields denote the interface used and the flow of the packet. In the snippet above, wlp0s20f3 is the name of the wireless interface and Out is the packet flow.
The fourth field includes information related to the network protocol name. Generally, you will find two protocols- IP and IP6, where IP denotes IPV4 and IP6 is for IPV6.
The next field contains the IP addresses or the name of the source and destination system. The IP addresses are followed by the port number.
The sixth field in the output consists of TCP flags. There are various flags that are used in the tcpdump output.
|
Flag Name |
Value |
Description |
|---|---|---|
|
SYN |
S |
Connection started |
|
FIN |
F |
Connection finished |
|
PUSH |
P |
Data is pushed |
|
RST |
R |
Connection is reset |
|
ACK |
. |
Acknowledgement |
The output can also contain a combination of several TCP flags. For example, FLAG [f.] stands for a FIN-ACK packet.
Moving further in the output snippet, the next field contains the sequence number (seq 196:568) of the data in the packet. The first packet always has a positive integer value, and the succeeding packets use the relative sequence number to improve the flow of data.
The next field holds the acknowledgment number (ack 1), or simple Ack number. The packet captured in the sender's machine has 1 as the acknowledgment number. On the receiver's end, the Ack number is the value of the next packet.
The ninth field in the output accommodates the window size (win 309), which is the number of bytes available in the receiving buffer. There are several other fields that follow the window size, including the Maximum Segment Size (MSS).
The last field (length 33) contains the length of the overall packet captured by tcpdump.
3. Limit the Count of Captured Packets
While running the tcpdump command for the first time, you might notice that the system continues to capture network packets until you pass an interrupt signal. You can override this default behaviour by specifying the count of packets you want to capture beforehand using the -c flag.
tcpdump --interface any -c 10
The aforementioned command will capture ten packets from any active network interface.
4. Filter Packets Based on Fields
When you're troubleshooting an issue, getting a big block of text output on your terminal doesn't make it easier. That's where the filtering feature in tcpdump comes into play. You can filter the packets according to various fields including the host, protocol, port number, and more.
To capture only TCP packets, type:
tcpdump --interface any -c 5 tcp
Similarly, if you want to filter the output using the port number:
tcpdump --interface any -c 5 port 50
The above-mentioned command will only retrieve packets transmitted through the specified port.
To get the packet details for a particular host:
tcpdump --interface any -c 5 host 112.123.13.145
If you want to filter packets sent or received by a specific host, use the src or dst argument with the command.
        tcpdump --interface any -c 5 src 112.123.13.145
tcpdump --interface any -c 5 dst 112.123.13.145
You can also use the logical operators and and or to combine two or more expressions together. For example, to get packets that belong to the source IP 112.123.13.145 and use the port 80:
tcpdump --interface any -c 10 src 112.123.13.145 and port 80
Complex expressions can be grouped together using parentheses as follows:
tcpdump --interface any -c 10 "(src 112.123.13.145 or src 234.231.23.234) and (port 45 or port 80)"
5. View the Content of the Packet
You can use the -A and -x flags with the tcpdump command to analyse the content of the network packet. The -A flag stands for ASCII format and -x denotes hexadecimal format.
To view the content of the next network packet captured by the system:
        tcpdump --interface any -c 1 -A
tcpdump --interface any -c 1 -x
6. Save Capture Data to a File
If you want to save the capture data for reference purposes, tcpdump is there to help you out. Just pass the -w flag with the default command to write the output to a file instead of displaying it on the screen.
tcpdump --interface any -c 10 -w data.pcap
The .pcap file extension stands for packet capture data. You can also issue the aforementioned command in verbose mode using the -v flag.
tcpdump --interface any -c 10 -w data.pcap -v
To read a .pcap file using tcpdump, use the -r flag followed by the file path. The -r stands for Read.
tcpdump -r data.pcap
You can also filter network packets from the packet data saved in the file.
tcpdump -r data.pcap port 80
Monitoring Network Traffic on Linux
If you've been assigned the task of administrating a Linux server, then the tcpdump command is a great tool to include in your arsenal. You can easily fix network-related problems by capturing packets transmitted on your network in real-time.
But before all that, your device must be connected to the internet. For Linux beginners, even connecting with the Wi-Fi via the command line can be a bit challenging. But if you're using the right tools, it's a snap.


