latest

How to Add Axis Titles to Charts in Excel
Want to make your Excel charts more informative? Learn how to add axis titles in just a few steps.

4 Chrome Extensions That Simulate Color Blindness
It's tricky to know what color blindness is like, which can make catering the web harder. These Chrome extensions help simulate color blindness.
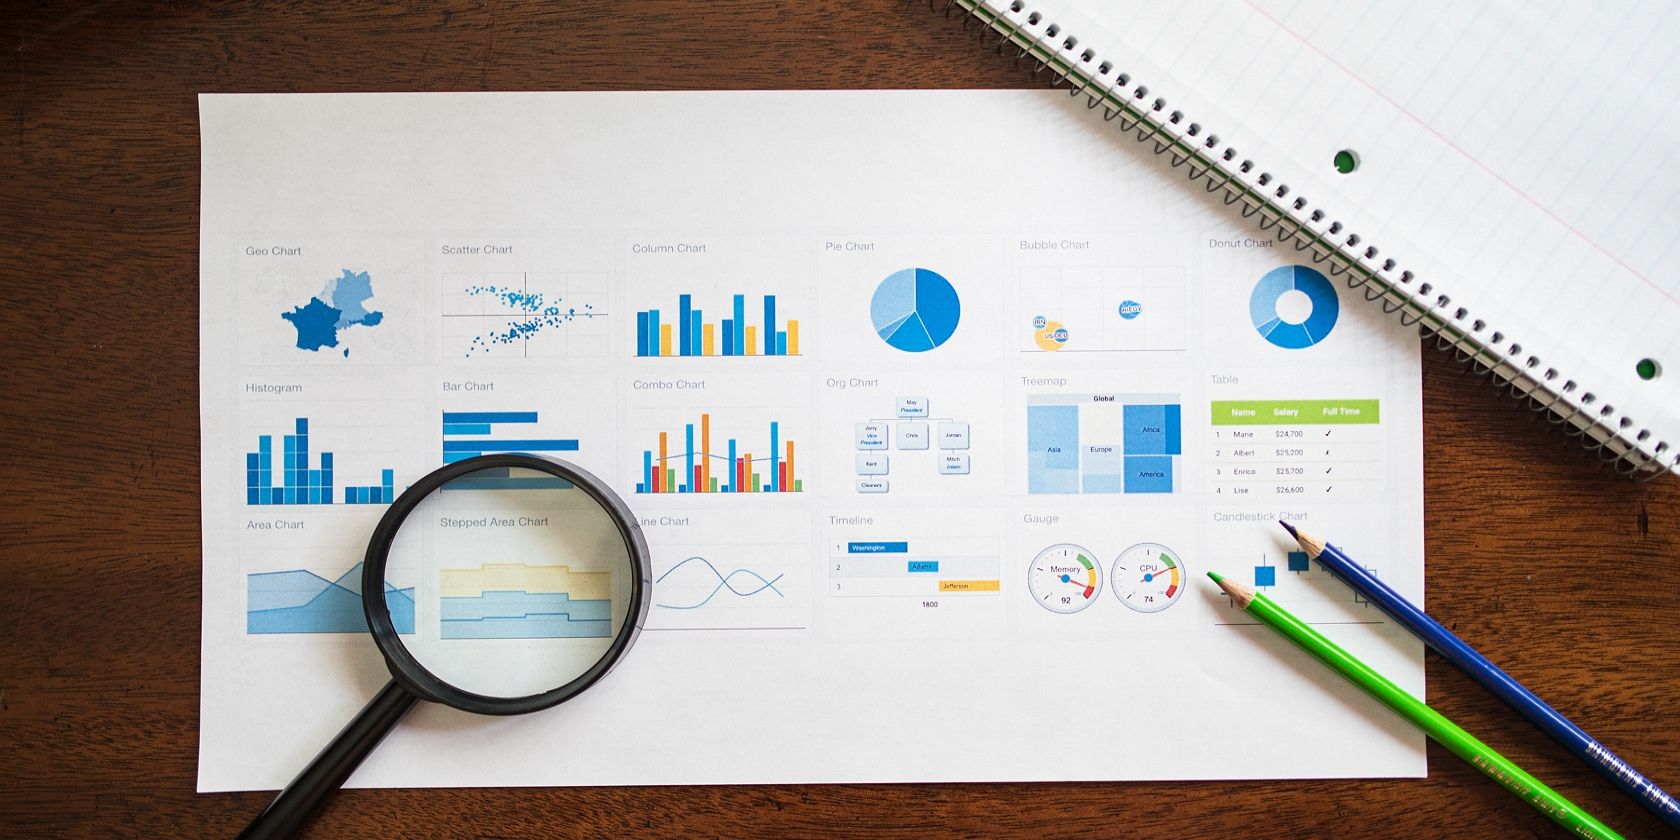
The 4 Best Visual Aids Tools for Every Task
Need help communicating your ideas visually? Here are some of the best visual aids tools for every task, from presentations to reports.

6 Ways to Use ChatGPT as a Data Analyst
Looking to level up your data analysis game? Here are some ingenious ways to use ChatGPT as a powerful tool in your data analyst toolkit.

5 Must-Have Visuals to Add to Your Online Resume
Looking to make your online resume stand out? Here are some must-have visuals that will help you get noticed.

How to Plot a Graph With Two Y-Axes in Google Sheets
Looking to create a graph with two y-axes in Google Sheets? Learn how to effectively plot your data and visualize dual-axis relationships.

How to Easily Create a Sankey Diagram Online for Free
Looking to create Sankey diagrams effortlessly? Here's how you can easily generate professional-looking Sankey diagrams online for free.

How to Create Data Visualizations in the Linux Terminal With YouPlot
Identify trends in data and make informed decisions by visualizing data in the Linux terminal with YouPlot.

The 10 Best Flowcharting Apps for Visualizing Your Workflows
Ready to streamline your workflow? Check out the top flowcharting apps that can help you visualize your process and boost productivity.
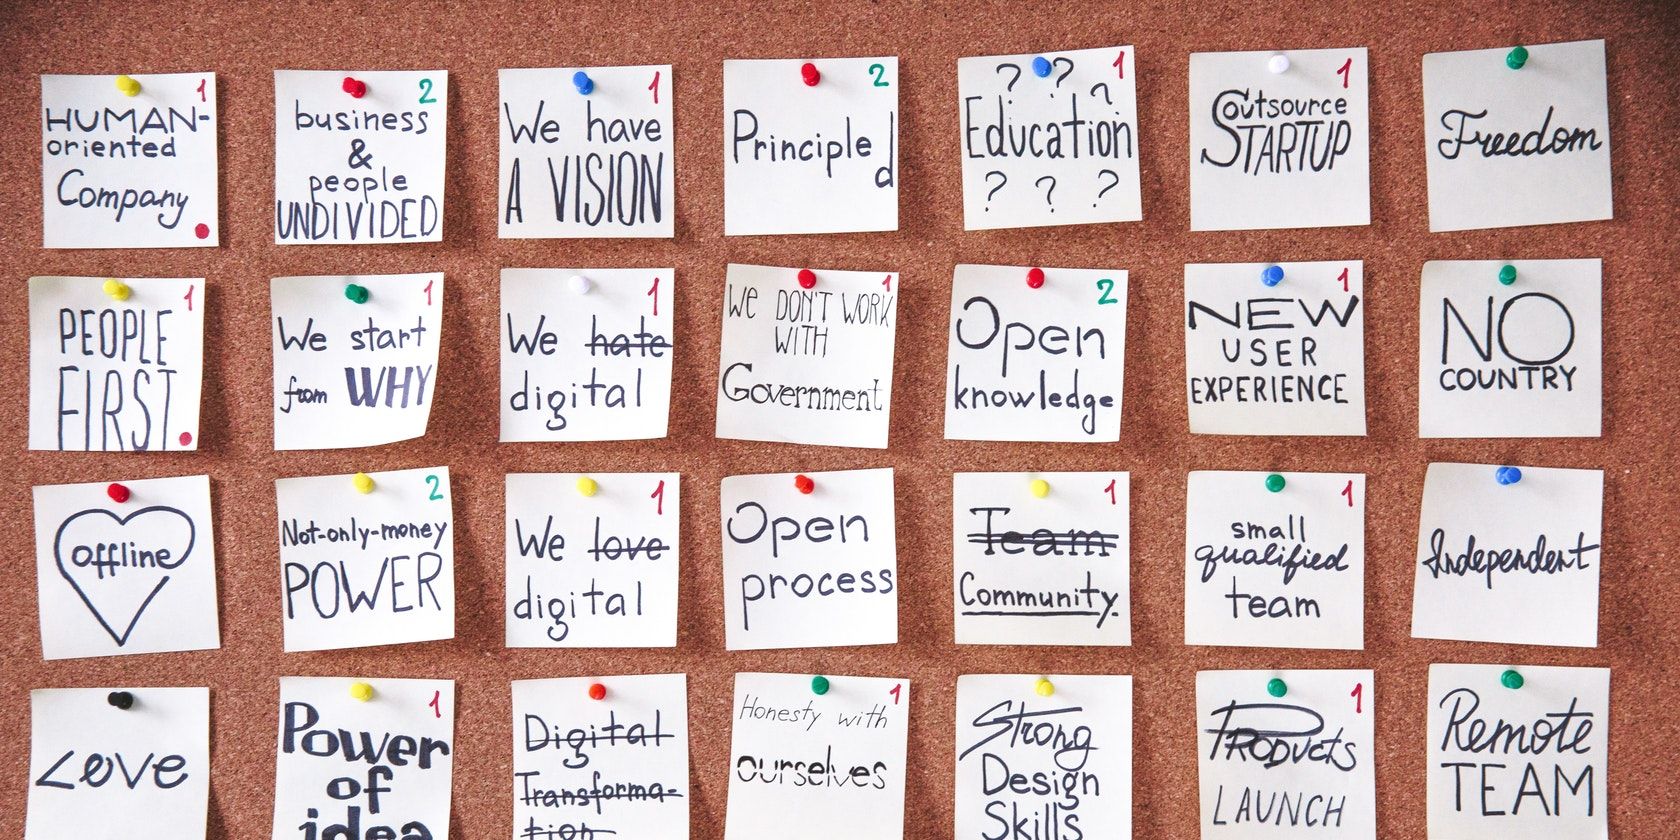
The 7 Best Tools to Create a Vision Board
Need some motivation to set your goals in motion? Check out these awesome tools for creating a vision board.

10 Skills to Learn to Become a Business Intelligence Analyst
Aspiring to become a business intelligence analyst and make a name for yourself? Check out these skills you'll need to learn.

Datawrapper vs. Tableau: Which Is the Best Data Visualization Tool?
Datawrapper and Tableau are both widely used data visualization tools, so let's see how they compare and which is best for you.
How to Create a Heat Map in Excel
Heat maps are a great tool to analyze large amounts of data quickly and compare different values. Here's how to create a heat map in Excel.

How to Install and Set Up Grafana on Ubuntu
Grafana is a feature-rich and open-source data visualization web app. Here's how to install and configure it on Ubuntu.

Why Alt Text Is Important and How to Write It Properly
Alt text is an important accessibility tool that lets people visually read images. Here's what you need to know about alt text and how to write it.

How to Become an Animation Writer
Interested in becoming an animation writer, but don't know where to begin? Here are some tips to help you get started!

Run Python Visualizations on the Web Using PyScript
Leverage Python’s first-class support for data analysis and visualization to spruce up your web pages.
How to Create a Heat Map in Google Sheets
Using a heat map, you can see a detailed visual representation of your data in Google Sheets. Here's how to create one.

How to Create a Venn Diagram in PowerPoint
Venn diagrams are illustrative graphics that show the relationship between sets of values. Here's how to create one in PowerPoint.
How to Create a Scatter Plot in Google Sheets
With a scatter plot, you can better visualize your data in Google Sheets. Here's how to create one!
