latest

How to Create a Chart in Power BI
Transform your data into compelling visual stories with charts in Power BI.

Fact Tables vs. Dimension Tables: Power BI
Fact and dimension tables are crucial components of Power BI data models. Enhance your data analysis by learning their differences.
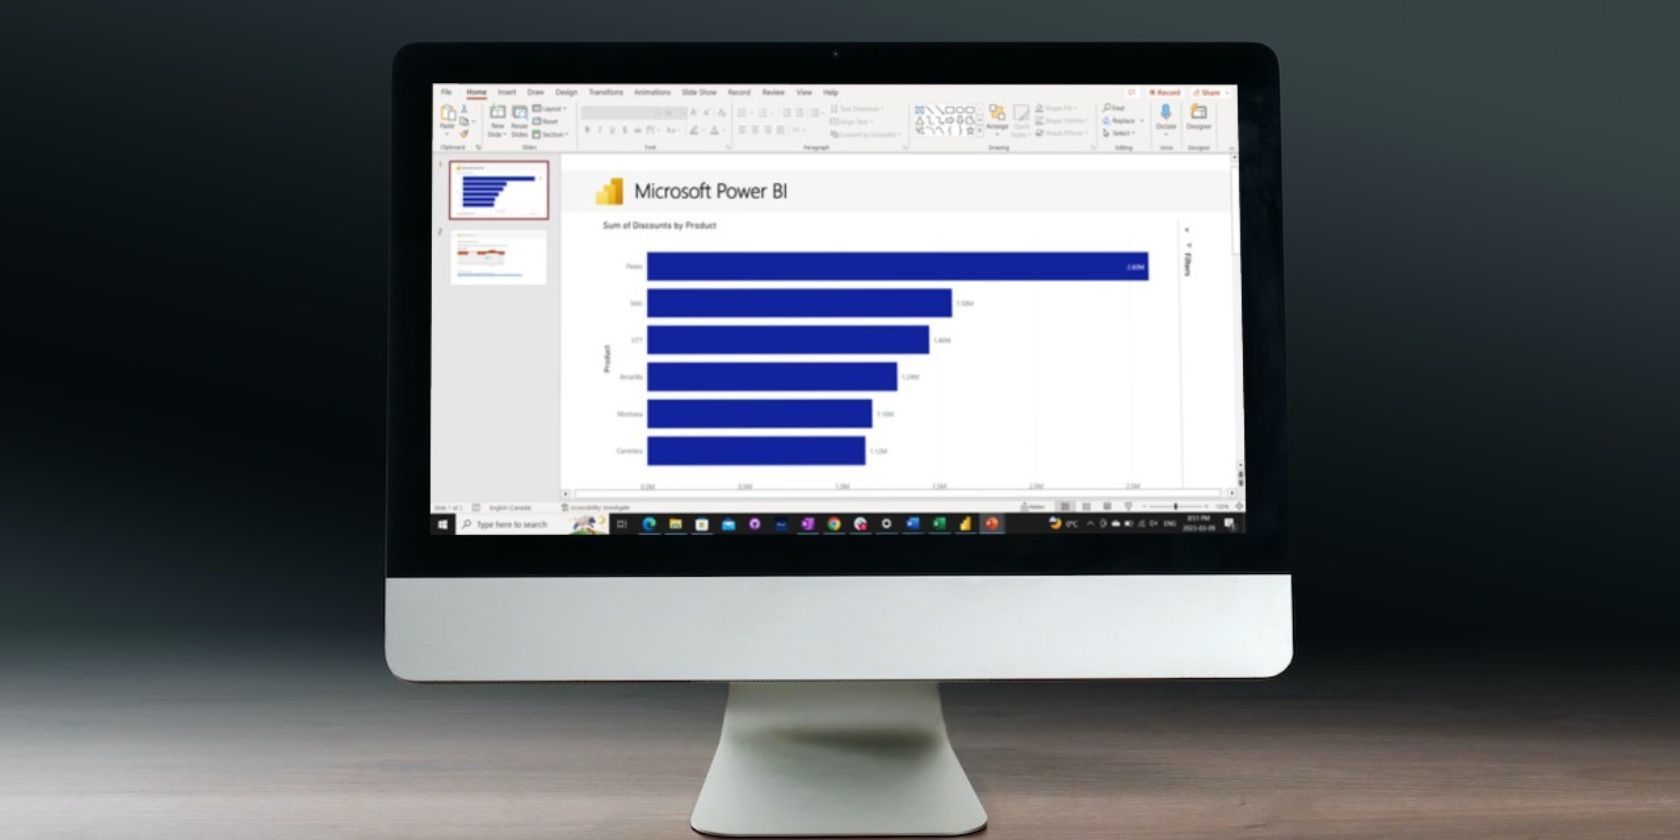
The New Power BI Features for PowerPoint You Don't Want to Miss
Let your data tell their stories. Take advantage of Power BI's integration with PowerPoint, which allows you to use live data in your presentations.
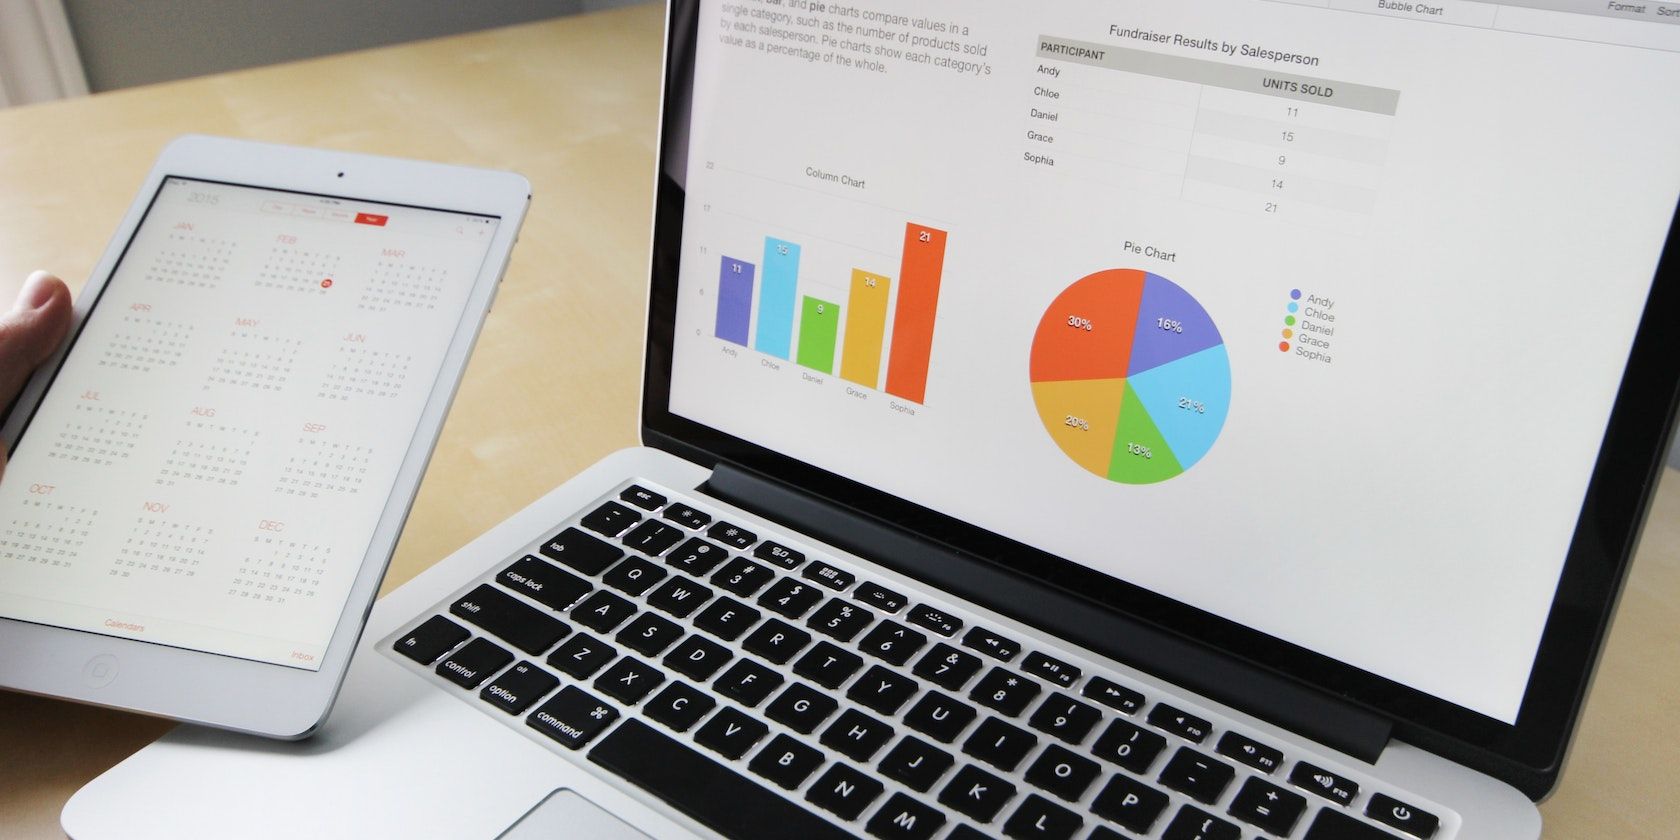
Microsoft Excel vs. Power BI: How Do They Compare?
Microsoft Excel and Power BI are both powerful tools for data analysis, but they have different strengths and weaknesses.

6 Online Courses to Master Power BI With Coursera
Power BI is one of the best business analytics tools for analyzing data and sharing insights. Find out how to use the tool with these online courses.

The 8 Best Apps That Can Replace Microsoft Power BI
Searching for a reliable and robust alternative to Power BI? We've compiled a list of the best tools.
Microsoft Power BI vs. Google Data Studio: Which Is Better?
Microsoft Power BI and Google Data Studio are two robust data analytics tools that can help you visualize raw and complex data. See which one is best!

Microsoft Power BI vs. Tableau: The Key Pros and Cons for Each
Are you trying to decide between Power BI or Tableau? Read this article to find out which one is best for your organization!

Power BI vs. Tableau: Which Data Analytics Tool Should You Choose?
Struggling to decide between Power BI and Tableau analytics tools? We've got all the info you need to make the right choice.

How to Use Cortana to Analyze Data With Power BI
Eager to simplify your data analysis? Get fast answers from Cortana with this guide.
Boost Your Skills with Free Microsoft Office Courses on edX
Kick-start your career in 2016 with free Office and programming courses from Microsoft, hosted at the online learning platform edX. We have compiled a selection of courses for advanced users and beginners.
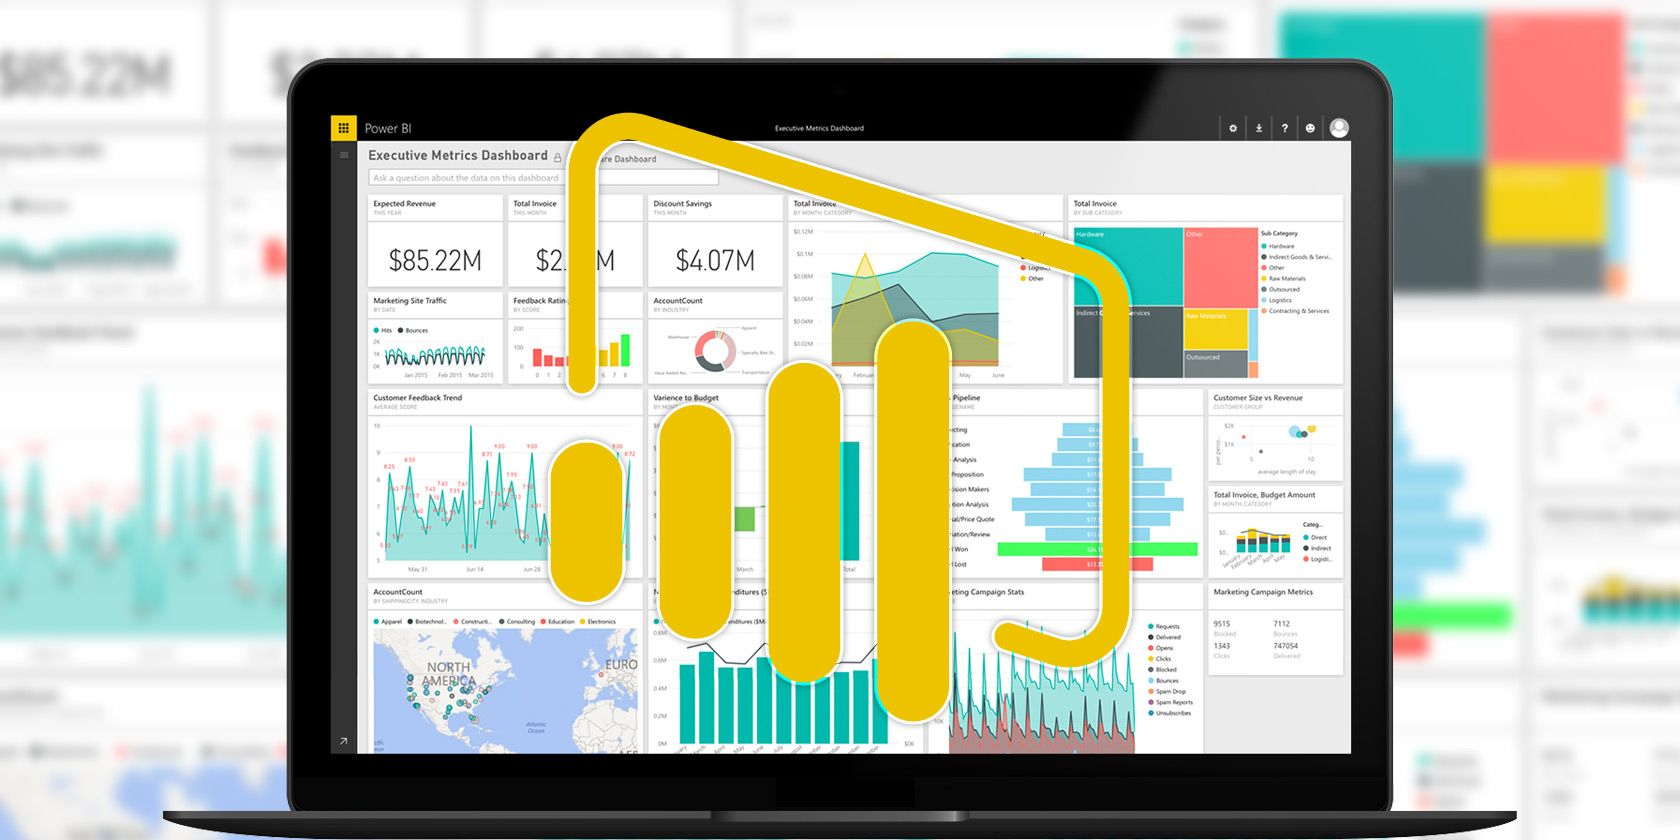
Microsoft Excel + Power BI = Data Analysis Bliss
Need help turning your data into something useful? Microsoft's Power BI can visualize your data and create automated reports. We show you how to set up your first Power BI dashboard.
How to Visualize Your Data Analysis with Excel's Power Tools
Excel is killing it with its advanced data management features. Once you have used one of the new tools, you will want them all. Become a master of your data analysis with power tools!
Power Up Excel with 10 Add-Ins to Process, Analyze & Visualize Data Like a Pro
Vanilla Excel is amazing, but you can make it even more powerful with add-ins. Whatever data you need to process, chances are someone created an Excel app for it. Here's a selection.
