latest

How to Do a VLOOKUP in an Excel Spreadsheet
You can use VLOOKUP to search for different values in a column of your Excel spreadsheet. We'll show you how.

How to Create a Spotify Pie Chart Based on Your Listening Stats
A third-party tool allows you to create a pie chart of your Spotify data. But is it safe to use?

How to Use Excel for Financial Analysis
Excel is an excellent tool for better understanding the health of your business. Here's how to use it for some common financial analysis computations.

How to Use Scikit-LLM for Text Analysis With Large Language Models
Powerful language models + Scikit-learn = Scikit-LLM. Perform text analysis tasks on the go with the help of this library.
6 Ways to Use Google Sheets for Data Analysis
Want to get more out of your data? Here are some powerful ways to use Google Sheets for data analysis and visualization.

How to Analyze Documents With LangChain and the OpenAI API
With a small amount of code and some useful libraries, you can build this powerful document analysis tool.

How to Check if Two Values Are Equal in Excel
In Excel, there are plenty of formulas you can use to determine if two values are equal. Here are some examples.

How to Count SQL NULL and NOT NULL Values in a Column
Handling NULL values is essential during data analysis. Learn how to count empty and non-empty values within a column.

Frameworks vs. Libraries: What Are They and How Do They Differ?
Frameworks and libraries might be mistaken for one another. It's crucial for developers to understand these differences.

How to Use the RANDARRAY Function to Randomly Sort Data in Excel
Want to add a little excitement to your data analysis? Learn how to use the RANDARRAY function to randomly sort your data in Excel.
How to Use the Aggregation Pipeline in MongoDB
If MapReduce has been your go-to, now could be the time to transition to MongoDB's Aggregation Pipeline for tackling complex operations.
Getting Started With Streamlit: A Practical Guide
Create interactive web applications for data science and machine learning projects using only Python, all thanks to Streamlit!

How to Deal With Duplicate Values in SQL
Dealing with duplicate values in SQL can be a cumbersome task. But fear not, this guide is here to ease your burden.

How to Use Logical Operators in Excel to Compare Data
Are you tired of manually comparing data in Excel? Learn how to use logical operators to automate this task and save time.

Fact Tables vs. Dimension Tables: Power BI
Fact and dimension tables are crucial components of Power BI data models. Enhance your data analysis by learning their differences.

5 Latest Data Science Tools You Should Be Using With Python
Python offers exceptional tooling for Data Science. Are you currently utilizing the latest and most efficient tools in your workflow?

How to Use the Quick Analysis Tool in Excel
Want to analyze your data in spreadsheets quickly and easily? Learn how to use the Quick Analysis tool in Excel.

Introduction to PandasAI: The Generative AI Python Library
Make use of the PandasAI Python library to leverage the power of artificial intelligence and large language models to perform data analysis tasks.
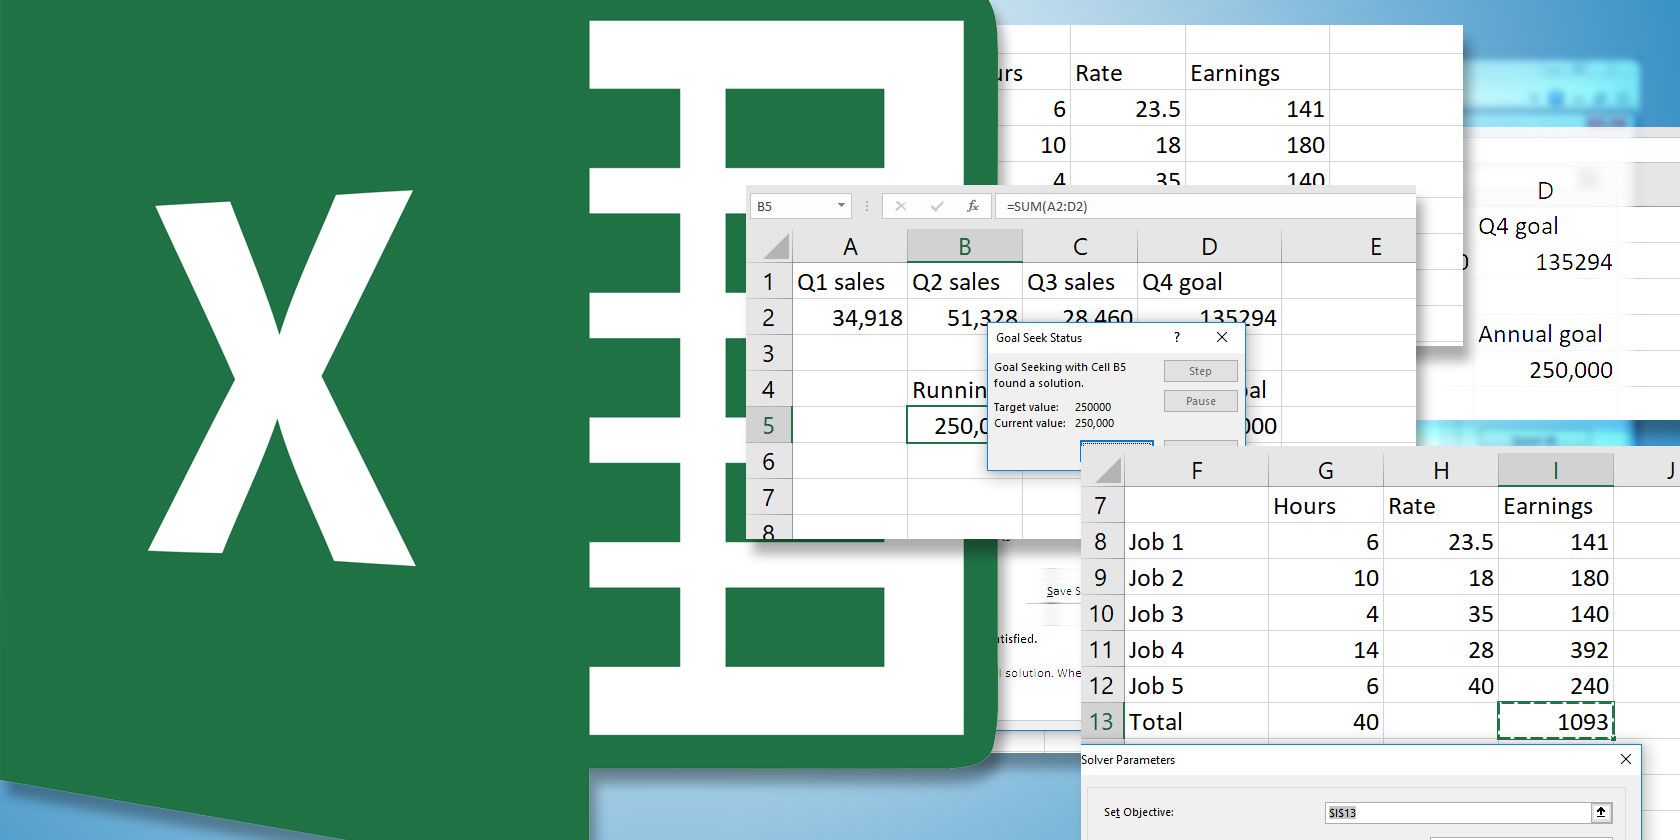
How to Use Excel's Goal Seek and Solver to Solve for Unknown Variables
Excel can solve for unknown variables, either for a single cell with Goal Seeker or multiple cells with Solver. We'll show you how it works.

7 Websites to Learn Data Analytics for Free
You don't have to spend money to learn data analytics. Begin your learning journey with these websites that are available for free.
