The Windows Blue Screen of Death visits us all at times. Sometimes, you expect it. At others, the specter of the blue screen looms unexpectedly large. Either way, it is frustrating, especially if you cannot quickly diagnose the issue.
Luckily, the blue screen always gives you an error code. But how do you figure out what that means? Well, you use a handy program like the Windows Debugger (WinDbg) or NirSoft BlueScreenView. Here's your handy guide to solving blue screen errors!
What Is a Blue Screen Error?
When Windows has a catastrophic error, the system crashes. The crash usually brings you a blue screen. The blue screen (affectionately known as the Blue Screen of Death, or BSoD) displays a whole load of information detailing the crash. Within the information is the why, where, and how the crash happened.
What Causes Blue Screen Errors?
A blue screen error can have several causes, including:
- Faulty hardware
- Faulty software
- Out of date or poorly coded drivers
- Overheating
- Overclocking
That's only five potential causes. Within those, there are numerous specific errors. That's where the blue screen of death error code steps in.
A blue screen of death error code gives you a specific error to troubleshoot. You can focus your efforts rather than take a guess at what went wrong and why. For instance, the code 0x80240034 WU_E_DOWNLOAD_FAILED means your Windows Update failed to download. Of course, that's unlikely to cause a BSoD, but you see how the code has a specific error message.
How Do You Fix a Blue Screen Error?
Fixing a blue screen error depends on the type of error. Sometimes, a cursory internet search is enough to reveal what's wrong with your system. At other times, special software for system debugging is what you need. Here's how you fix your blue screen error using WinDbg or NirSoft BlueScreenView.
How to Fix Blue Screen Errors With WinDbg
WinDbg is a powerful tool you can use to figure out the root cause of your blue screen error.
Installing Windows 10 SDK
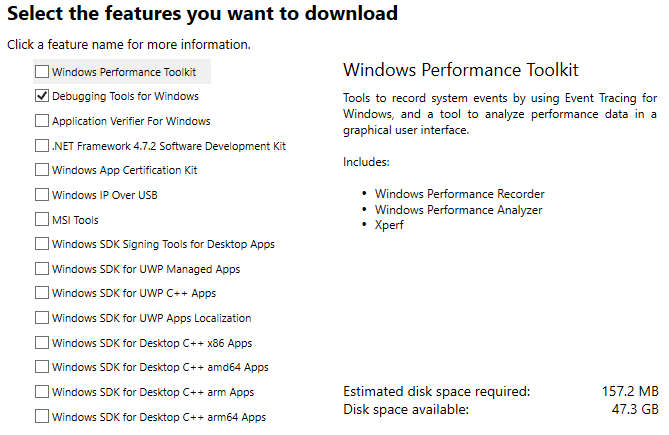
Head to the Windows 10 SDK download page. The Windows 10 SDK contains numerous tools, including the Windows Performance Toolkit, Debugging Tool for Windows, the .NET Framework Software Development Kit, and other development tools. Follow these steps now.
- Hit the Download the Installer button. Once downloaded, run the installer.
- When the Windows 10 SDK installer opens, select the first option to Install the Windows Software Development Kit to your computer. The default installation path is fine.
- Select Next to continue and accept the license. On the next page, uncheck all boxes bar the Debugging Tools for Windows.
- Then press Install.
Opening and Configuring WinDbg
Open your Start menu and head to Windows Kits > WinDbg. Use the debugger for your system architecture, be that 32 or 64-bit. I have a 64-bit system, so will choose WinDbg X64.
Now, you need to find your BSoD memory dump. The dump contains the information regarding the crash, such as "cause" and "location".
There are two main types of BSoD memory dumps: a full dump and a minidump. Typically, a minidump is smaller but contains more information than a full dump (I know, how misleading).
- You will find the minidump logs in your root directory, typically C:\Windows\Minidump. In the folder, you will find the actual minidump logs.
- Alternatively, the full dump is found at C:\Windows\memory.dmp
For this tutorial, we're going to analyze a minidump (because that's what I have at hand).
Note: Don't have any dumps at all? See how to turn on post-crash Windows dumps.
Okay, back to WinDbg. First, you need to set a symbols source. Symbols are essentially identifiers for programming languages that relate to specific information. They make it easier to analyze the information found in a log (or code).
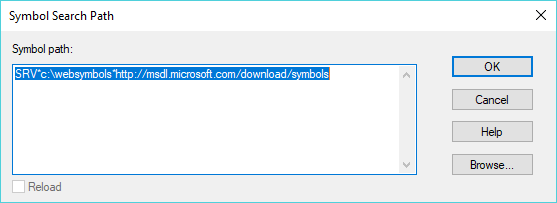
Head to File > Symbol File Path, then copy and paste the following:
SRV*c:\websymbols*http://msdl.microsoft.com/download/symbols
Then press OK.
Analyzing Your Crash Dump in WinDbg
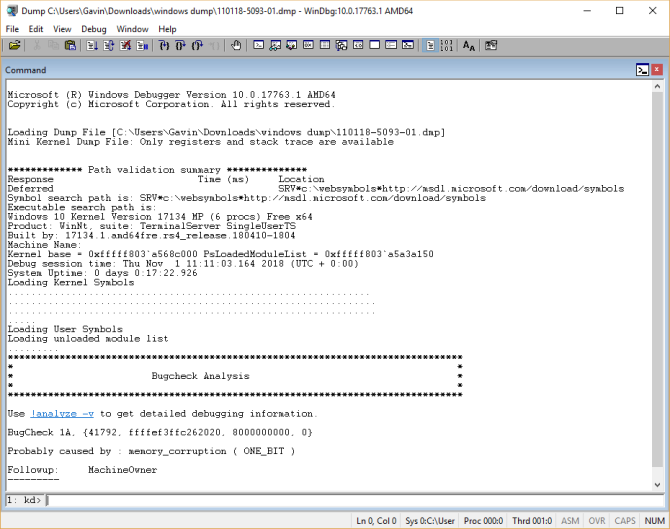
Drag and drop your dump file into WinDbg. Alternatively, press Ctrl + D to open the file browser, then locate your dump file. When the dump file loads, you will encounter the initial analysis screen. It will look similar to this:
There are two things to take in from this screen: the BugCheck and the Probably caused by fields. Here they are in greater clarity:
- BugCheck 1A is the error code
- Probably caused by: memory_corruption ( ONE_BIT ) gives you an instant idea of the issue at hand
In this case, you know that a memory error is the likely cause of your BSoD.
You can take the analysis one step further using WinDbg commands. In this case, the !analyze -v command (highlighted in blue in the above image) will show you detailed information relating to your BSoD. There is a command link under the Bugcheck Analysis header. However, this link sometimes disappears. If there is no link, enter the command in the field at the bottom of the WinDbg window.
The command performs a huge amount of automated analysis. WinDbg displays the results under a new BugCheck Analysis header. The amount of information WinDbg throws out feels a little overwhelming. But in this case, you are only looking for a few key bits of information to bulk out the assessment of your BSoD.
The parameters directly underneath the new BugCheck Analysis header provide another set of useful information. For instance, in the example below, you can see the fault confirmed as Memory_Management (1a). Additionally, the Arguments (arguments are essentially informative parameters) expand on the information.
Arg1 states that "A corrupt PTE has been detected," explaining that "Parameter 2 contains the address of the PTE."
Now, I know that PTE stands for Page Table Entry, so this error is likely to relate to my virtual memory, and I can start my BSoD fix there. However, there's a huge amount of errors that I've no idea about.
In those cases, an internet search is your friend. Searching for a combination of the initial error code and the additional argument information will return results of other users suffering the same issues. In many cases, the system error you have isn't new and mysterious. The same BSoD will have affected someone else---you're not alone.
How to Fix Blue Screen Errors With BlueScreenView
The WinDbg analysis tool is a powerful bit of kit. You can use it for all manner of dump and file analysis. However, many readers won't require the full spectrum of analysis tools WinDbg offers. If that sounds like you, Nirsoft's BlueScreenView is exactly what you need.
It analyzes the same dump and minidump files as WinDbg but streamlines the information. You can take the streamlined information to an internet search and start your BSoD process from there.
Here's how it works:
Go to the BlueScreenView page and download the program. Once it downloads, install BlueScreenView. Open the program after installation.
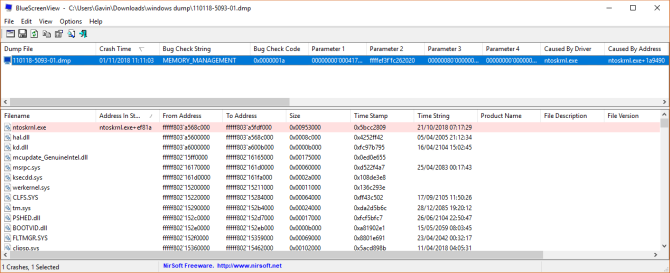
Here's where BlueScreenView is handy. It automatically loads any minidumps found in the MiniDump folder. You can then sort the dumps by Crash Time to find the latest BSoD. In the below image you see the BlueScreenView version of the dump file analyzed in the WinDbg section.
The major difference is the layout and comparative ease of finding the BSoD information. The Bug Check String, Bug Check Code, and Parameters are the same. BlueScreenView also identifies the ntoskrnl.exe driver as the root of the BSoD.
As with WinDbg, you can now complete an internet search with your BSoD information.
WinDbg vs. BlueScreenView
Is one blue screen of death analysis tool better than the other? It depends on what you want to achieve.
BlueScreenView is undoubtedly easier to use than WinDbg. If you need quick, concise information regarding your BSoD, BlueScreenView is the better tool. The majority of people will get along just fine with BlueScreenView, especially given it requires no configuration and provides the desired information immediately, and in a digestible manner, too.
For more help, check out our general tips for fixing blue screens in Windows.

