Wouldn't it be nice to have the ability to just open up an Excel spreadsheet or a Word document, and without having to do anything at all, data gets read directly out of a text or CSV data file and loads directly into a chart embedded onto your spreadsheet or Word document? This is a form of automation using Office products, because if it's possible to automate the charting of data in Office, just think of the possibilities. You can automatically load data into a chart for a report that you're putting together for your boss - no data entry required. Or you could load data into a chart directly into an email in Outlook.
The technique to accomplish this involves installing the Office Web Components add-in. Furthermore, you just need to configure a few things inside of the Office application that you want to use to import the data, and you're ready to start automating your reporting work. I've covered some of the elements that we're going to use in this article in previous VBA articles here at MakeUseOf. A few of those included passing data between applications with the clipboard, exporting Outlook tasks to Excel, and sending Emails from an Excel script.
What I'm going to show you is how to combine Office Web Components with text file scripting to create a seamless, automated stream of data from a flat text file on your computer into your Office product (in our case Excel). You can use this same technique - with a few small modifications - in Word, Outlook, or even PowerPoint. Any Office product (or any other product for that matter) that has a VBA back-end for developers, will allow you to use this technique.
Import and Create a Graph From Data Files
Before you can create a graph from data files, you'll need to enable a few things first. In this example, I'm going to show you how to enable these features in Excel, but the process is nearly identical in every other Office product.
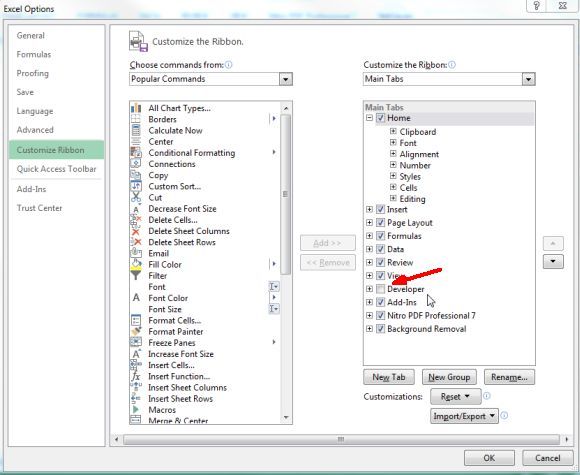
First, before you can do any VBA development, you need to enable the developer tab in the toolbar (if you haven't already). To do this, just go into the Options menu, click in "Customize Ribbon" and enable the "Developer" tab.
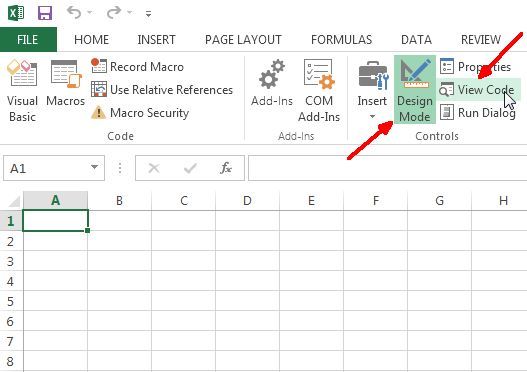
Back in Excle, you'll now see "Developer" show up in the menus. Click on it and click on "Design Mode". Then click on "View Code" to see the VBA editor.
Inside the editor is where you'll need to enable the references that you'll need for the code I'm going to give you to work. Make sure you've installed the Office Web Components add-in before you do this, otherwise the Microsoft Chart object won't be available.
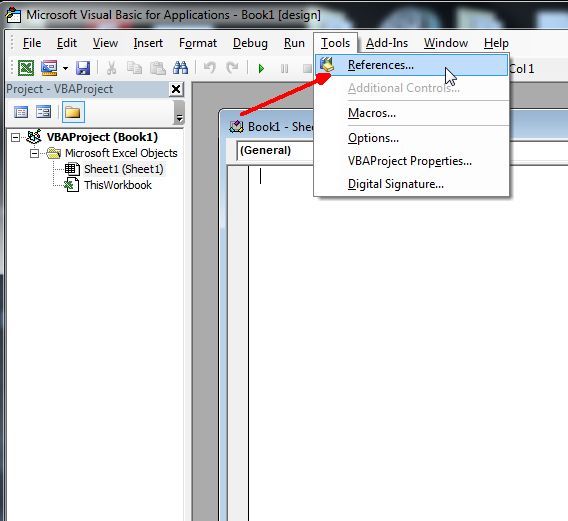
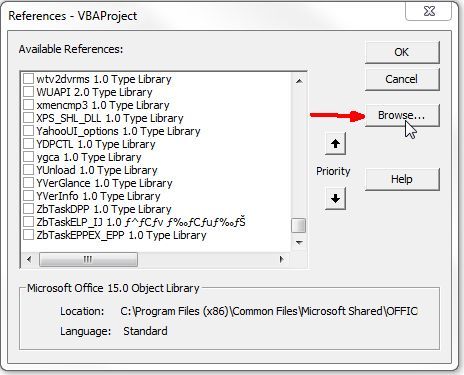
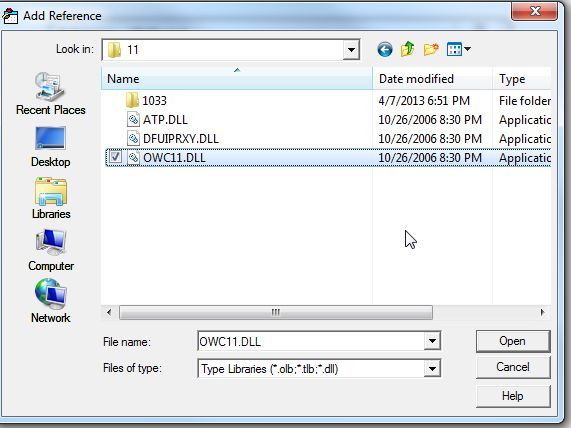
Click on Tools and then References, and you'll see a list of all of the references that are available on your system. If you don't know what these are - references are basically libraries of code and objects that you can pull into your own project. These allow you to do some really cool things, depending what reference you enable. If you've just installed Office Web Components in your system, you'll need to add it as a new library, so click on the Browse button to find the correct .dll file.
If you've installed Office Web Components, then the DLL file is called OWC11.dll, and it's stored in c:\program files\common files\microsoft shared\web components\11\
Click the checkbox for the "Microsoft Office Web Components 11.0" reference, and also don't forget to select "Microsoft Scripting Runtime" as well, which will give you access to read or write from data files.
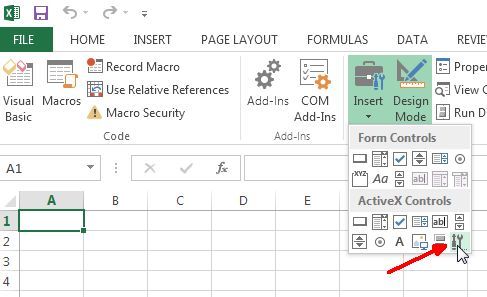
Now that you've added the reference, it's time to add the actual chart to your sheet. In Excel, you can add controls by clicking on "Insert" in the Developer menu, and clicking on the little tools icon in the corner under "ActiveX Controls".
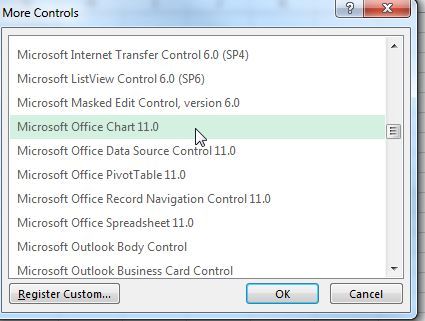
Scroll to "Microsoft Office Chart 11.0" and click OK.
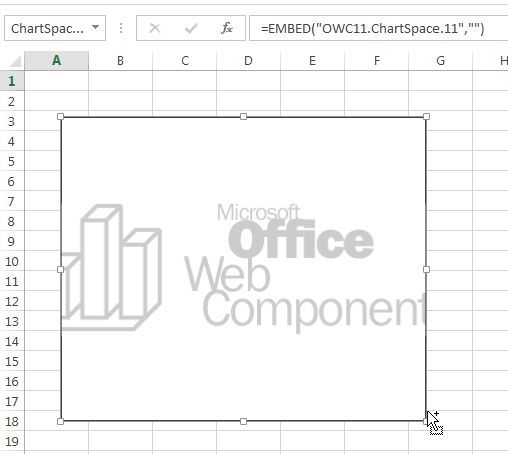
We're finally getting down to business. Here's what the MS Web Component chart looks like embedded into a spreadsheet. It'll look the same embedded into a Word document or anything else.
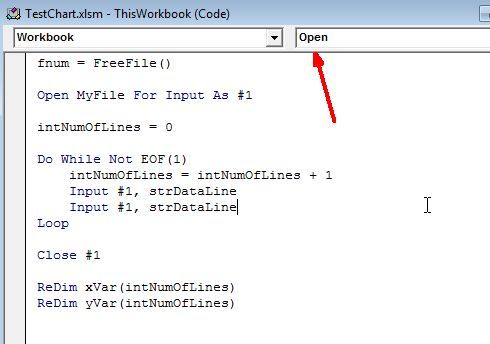
So, in the case of Excel, I want the chart to instantly load data from the data file upon opening the workbook file. To do this, you go into the code editor by clicking on "View Code" in the Developer menu, and double click on the Workbook to see the workbook code. Change the right dropdown to "Open". This is the script that will run when the workbook file is first opened.
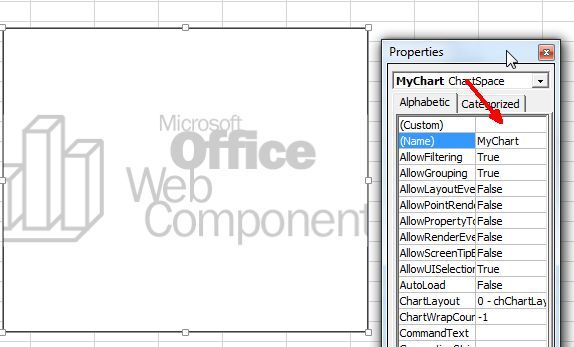
To load the chart with data from code, the chart itself needs a name. Go back to the spreadsheet, right click on the chart and choose Properties. You'll see the "Name" field with something like "ChartSpace1". You can change this to anything. I've called mine "MyChart".
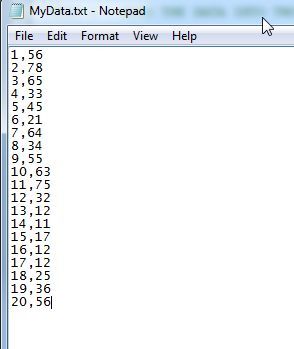
Also, just so you know what the data file is like - mine is a text file filled with data values in comma-delimited format. This file could be anything at all - lab data exported from sensors, financial information typed into the file manually by interns, or anything else at all. You'll be reading the file in with your code, so it doesn't matter what the data looks like, so long as you know what each line will look like when your program reads it in.
So, now for the fun part. I'm going to show you the code in small sections so it's not overwhelming, and explain what the code does. The top of the code is first going to read in all of the values from the text file and store them in two arrayx, one for x variables (xVar) and one for y variables (yVar).
Dim fso As New FileSystemObject

            Dim fnum

            Dim MyFile As String

            Dim strDataLine As String

            Dim xVar() As Variant

            Dim yVar() As Variant

            Dim intNumOfLines As Integer

            MyFile = "c:\files\MyData.txt"

            fnum = FreeFile()

            Open MyFile For Input As #1

            intNumOfLines = 0

            Do While Not EOF(1)

             intNumOfLines = intNumOfLines + 1

             Input #1, strDataLine

             Input #1, strDataLine

            Loop

            Close #1

            ReDim xVar(intNumOfLines)

            ReDim yVar(intNumOfLines)

            Open MyFile For Input As #1

            intNumOfLines = 0

            Do While Not EOF(1)

             Input #1, xVar(intNumOfLines)

             Input #1, yVar(intNumOfLines)

             intNumOfLines = intNumOfLines + 1

            Loop

            Close #1
This code basically runs through the data file twice - the first time to dimension the arrays so that they are the exact length needed to store the data, and then a second time to read the data into those arrays. If you don't know what an array is - it's a variable or a storage area that will contain a long list of values that you can access by using the order that the value was stored in array. The one loaded third would be (3), for example.
Now that you have two of these arrays loaded with all of the values from your data file, you're ready to load those values into the chart that you've already embedded. Here's the code that does that.
With Sheet1.MyChart

             .Clear

             .Refresh

             Set oChart = .Charts.Add

             oChart.HasTitle = True

             oChart.Title.Caption = "My Data Values"

             'oChart.Interior.Color = "blue"

             oChart.PlotArea.Interior.Color = "white"

             Set oSeries = oChart.SeriesCollection.Add

             With oSeries

             .Caption = "My Data Values"

             .SetData chDimCategories, chDataLiteral, xVar

             .SetData chDimValues, chDataLiteral, yVar

             .Line.Color = "blue"

             .Line.DashStyle = chLineDash

             .Line.Weight = 2

             .Type = chChartTypeLine

             End With

            oChart.HasLegend = True

            oChart.Legend.Position = chLegendPositionBottom

            End With
It's the "Sheet1.MyChart" that connects the code to the actual chart you've embedded. It's based on what you named it. This will be the case when you embed it in Word, Powerpoint, or any other Office product. You won't be referring it using "Sheet1", but instead whatever element holds the Chart in that case, such as "document1" in Word for example.
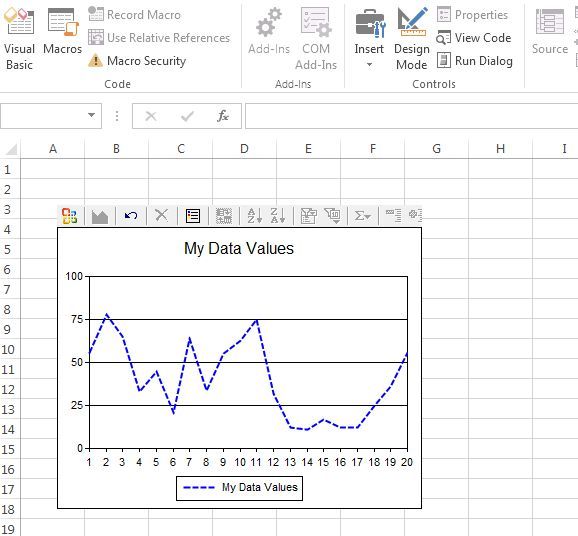
The code above then sets up the labeling and coloring of the graph, and then loads the values using the ".setdata" method for both x and y values of the 2 dimensional dataset. Once the above code is done running, the following graph will appear.
This data is straight out of the text file. The only drawback here is that the data files would need to be two dimensional only if you want to use the code above. You could add more values to the data set, but you'd need to modify the code above to read in the third value each time through the loop, and then duplicate the "SeriesCollection.Add" section to create another series and then add it to the chart in the same way.
It may seem complex just reading the code above, but once you've done one of these, it's a piece of cake to modify it for whatever your needs are. You could use the same chart and similar code to create a bar chart, a scatter chart, or any other chart type you want using this same object. It's versatile and flexible - and it's a powerful tool in your arsenal if you've a fellow fan of automation for greater productivity.
Play around with the code above and see if you can auto-load data into your applications. What creative uses can you think up for this type of automation? Share your thoughts and feedback in the comments section below!


