Aristotle once said, "All men by nature desire knowledge", but is there such a thing as too much knowledge? As you'll see shortly, when it comes to search query data and your SEO numbers, there's no such thing as too much information.
At the end of 2013, Google decided to quietly add a few small features to the Search Queries tool in Google Webmasters that could potentially change how you focus your resources on topic research. While most people at this point in time realize that content generation on the web is three parts creativity and user-focus, there is still one very big part that is keyword research.
The term "keyword research" these days has bad connotations, because of the years past when so many webmasters focused primarily on search engine keywords and bypassed the idea of making the site actually interesting to the sorry souls who landed there from a search engine query. Through the past couple of years and countless algorithm updates later, Google is still working its way toward a sort of artificial intelligence method of understanding the context and intent behind a user's search, and then providing the web pages that Google - in all of its Googlebot wisdom - deems as the highest quality.
These Search Queries changes give you a very powerful tool that provides you with insight into which of those queries Google considers your site as a top authority, and the queries where you fail. This can provide you with tremendous ammunition to improve your website, but you need to know how to use the tool, and understand how the data is now laid out for you.
Search Queries Now Show Change
The big change on the search queries tool on Google Webmasters is the fact that each metric now shows the percentage of change - either positive or negative - for that metric over the last previous period. It sounds like a small thing, but the impact of it is significant, because it lets you immediately focus in on important information like where you've just lost ground with your search engine position, where you've gained the most, where your clickthrough rates have changed the most, and much more.
Monitoring Your Query Changes
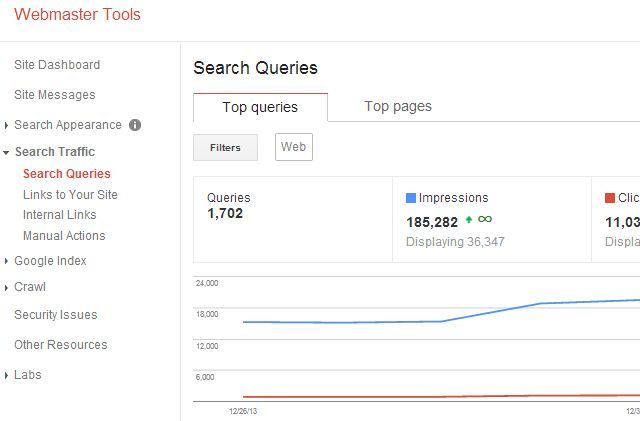
To get to the Search Queries tool, just go into your Webmaster Tools account, click on the "Search Traffic" dropdown in the left menu, and click on "Search Queries".
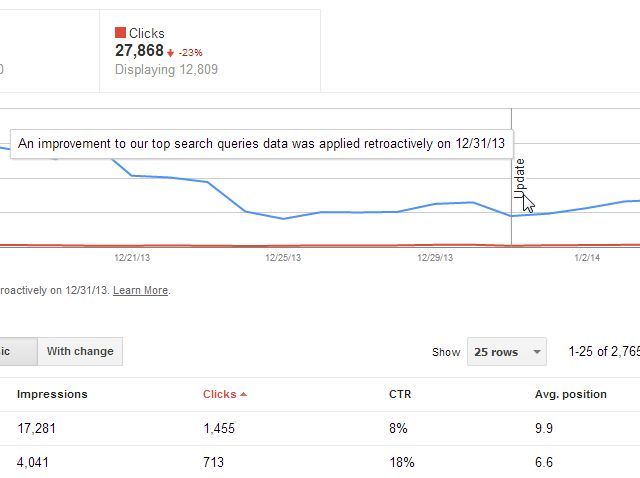
If you've been using the Search Queries tool already, then you might have noticed that on December 31st, a vertical line showed up with the word "Update" to mark the moment when the new "change" data started showing up in the Search Queries results.
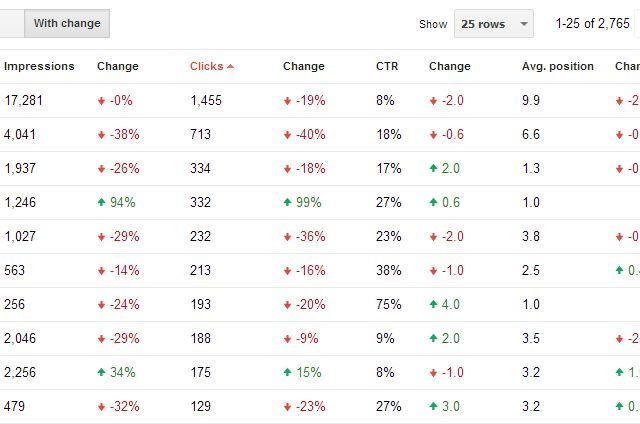
You won't actually see any difference in the data until you click on the "With change" button at the top of the results table next to the "Basic" button.
As you can see, now each column includes a "Change" percentage, which is the amount of change for that search query compared to the previous period to the one that you've set the current chart at. For example, if you set the period to the last seven days, the change field will show you the direction and size of the change over or under the previous week.
How to Use Change Percentages
Previously, you could see fairly static data that represented your current standing as far as impressions, CTR, clicks and search query position. Sure, you could go ahead and modify the time frame, jot down all of the values of the previous week, and then calculate change - but who wants to do that for all of your top search queries?
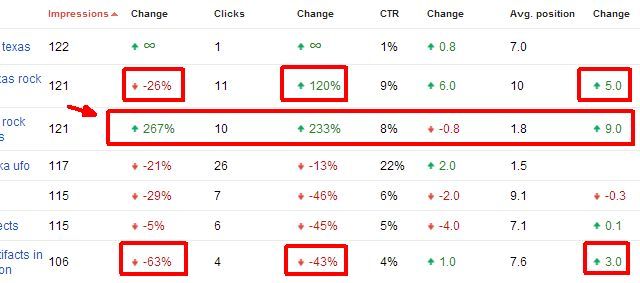
Nope, now you've got all of those calculations right in the table within arm's reach. It's very sweet. And the data itself tells you a great deal. For example, you can see that one of the titles below, within the past week, rose 5 whole positions in the search engine listing for that query, the number of clickthroughs to my site increased 120%, which is to be expected, but strangely enough the actual number of impressions dropped by 26%. This can be due to a whole laundry list of reasons - actual queries for that term actually dropped in volume maybe. Then below that, I've got a 9 point position increase, with 233% more clicks, and 267% more impressions.
That's a page you want to analyze more closely to see why Google would like it so much more this month than last month. Did you make changes to the page? Are seasonal trends impacting those results? Figuring that out could help you create even more content that Google loves to list high in search results.
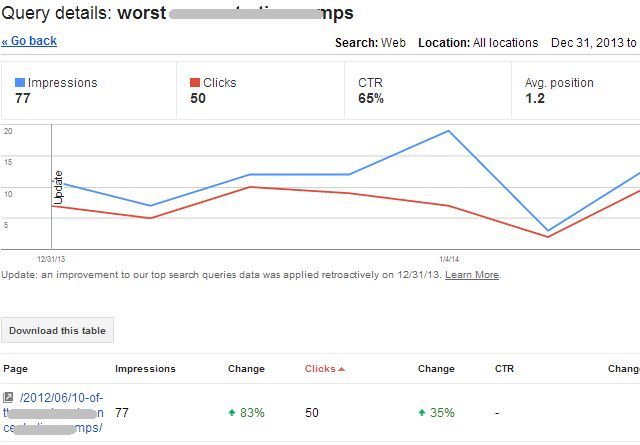
When you click on individual search trends, you'll see the page on your site that was listed for that keyword term, along with the specific stats for that page. The best part of this view is that you get an overlay of both impressions and clicks.
When impressions and clicks go up together, you're looking at a situation where interest in the topic has increased, and you're competing well against other sites that cover the topic. Increasing impressions and decreasing clicks means either interest in the topic has slowed, and you're facing less competition because of it (this can happen with short term news stories). The case of dropping impressions and dropping clicks could either mean there's less interest in the topic, or it could mean you're facing more competition on the topic.
Analyzing Overall Position Changes
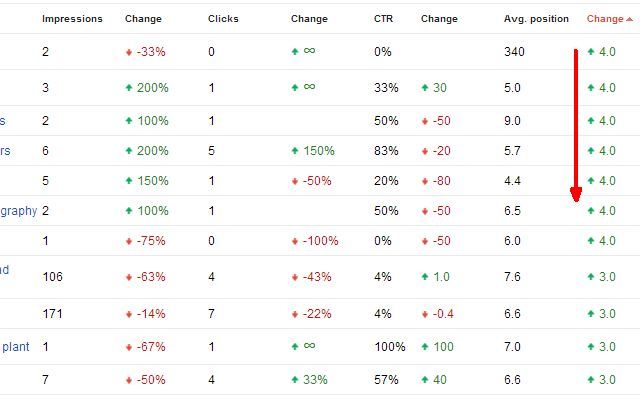
Back on the overall results page, you want to also do a sort on the table by the amount that your pages have changed in average search listing position. First, listing from the biggest positive change will show you which of your pages have suddenly shot up in search engine listings. For some reason - either those pages are considered higher authority and credible (linked to from other credible sites), or you're facing less competition.
Figuring out why those pages are doing so much better suddenly can give you some very big clues as to some of the secret changes Google might have made to its algorithm. You may notice that suddenly a whole bunch of your list articles shot up the most one month - maybe Google tweaked the algorithm to value high-quality external links. Maybe you just did some SEO optimizing to a section of your site - this table will show you whether there's been a big shift in your page rankings as a result.
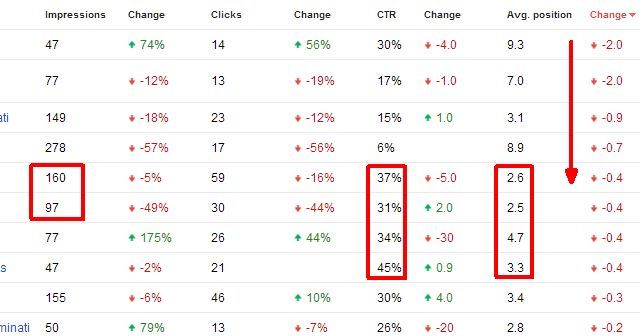
On the flip side, you also want to sort average position change from the biggest negative change as well.
This is a valuable way to see which of your pages might have been negatively impacted by a Google algorithm change, by increased competition from other websites on the topic those pages cover, or anything else. At least knowing that you've lost some ground can help you compete better by taking a look at that page, checking out what the top-ranked website is doing for that search term, and then optimizing your page to perform better.
These days, you'll hear a whole lot of silly hoopla that SEO is a dead or dying industry. The reality is that SEO has just become a little bit more complex, and way more competitive. It takes a lot more work these days to monitor the changing trends, and to act fast enough to respond and outperform your competitors. This recent feature on Google Webmaster Tools is clearly one of the newest, most effective weapons you now have at your disposal to become a much more competitive and high-performing website owner. Take advantage of it.


