Microsoft Excel has an array of useful features for creating powerful spreadsheets with charts and tables. But, when you want to take your spreadsheet to the next level, beyond fancy text or themes, you may need the help of an add-in.
With these handy tools, you can create more visually stimulating representations of your data. For printing, presenting, or providing a better view of your spreadsheets and what they contain, check out these awesome Excel add-ins.
1. Excel Colorizer
For an easy way to add color to your spreadsheet data, the Excel Colorizer add-in works great. To make your data simpler to read, just pick the colors and pattern and let the add-in do the rest of the work.

You can choose a type from uniform, horizontal, vertical, or matrix and pick your four colors. Then, adjust the interpolation to smooth or linear and the color space to RGB or HSV. You can also pick the pattern from interlaced or waves. So, select your data, make it look amazing, and hit Colorize! to finish.
2. Radial Bar Chart [Broken URL Removed]
While Microsoft Excel offers many chart options, Radial Bar Chart gives you one more. This add-in follows its name in providing exactly what it says: a radial bar chart. Access the add-in, select the cells containing your data, and then adjust the chart as you like.
You can pick the labels, numbers, and set a title. Hit Save and your chart will be created automatically. Move or resize your chart and run your mouse over the bars to display the data for each. The add-in is quick, simple, and gives you another chart style option for your data.

3. HierView
For displaying an organizational chart, HierView is the add-in for you. Your data should include a row identifier with the information included across the columns. Then, configure your data with filtering, automatic refreshing, column names, and data per node.

Once your chart is complete, you can zoom in or out, move in all four directions, or fit the chart to the plotted area. You can also move the entire chart or resize it if needed. Adjust the settings or get help at any time with the convenient buttons at the top of the chart.
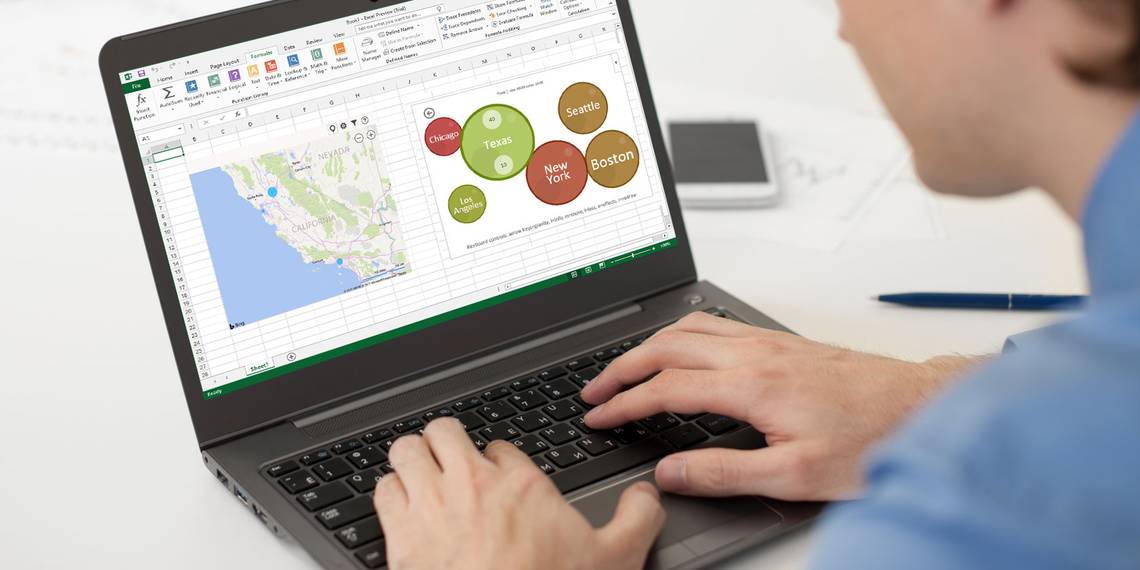
4. Bubbles
Would your data look better in a bubble? If so, then Bubbles is the add-in you should try. This interactive bubble chart tool lets you display information in a unique way. Just open the add-in and select your table of data. When the chart is created, you can move the bubbles around while presenting or leave them as they are.
Bubbles has a few settings you can adjust for basic or detailed mode, color range, and the title and column displays. You can also use the keyboard shortcuts shown at the bottom of the chart for things like hiding or showing more information or bouncing the bubbles about.

5. Bing Maps
If adding a map to your spreadsheet is useful, the Bing Maps add-in makes it simple. Your data can include addresses, cities, states, zip codes, or countries as well as longitude and latitude. Just open the add-in, select your data cells, and click the Location button on the map.

The Bing Maps tool is ideal for displaying numeric data related to locations. So, if you work in sales, you can show new markets to cover or if you work for a company with multiple locations, you can present those facilities to clients clearly.
6. Geographic Heat Map
When a heat map is what you really need, the Geographic Heat Map add-in is terrific. From the same developer as the Radial Bar Chart add-in, you have similar settings. Select your data, choose a U.S. or world map, pick your column headings, and add a title.

You can reselect the data set if you add more columns or rows and if you change a value already in the set, you will see the heat map update automatically. For a fast glance at data related to countries, states, or regions, you can pop this heat map into your spreadsheet easily.
7. Pickit Free Images
For adding photos and other images to your spreadsheets, Pickit Free Images is the perfect tool. Once you access the add-in, you have a few options for finding the image you need. You can do a keyword search, browse through collections, or pick a category from a huge selection.

Click a spot to put it in your spreadsheet, select the image you want, and hit the Insert button. You can move, resize, or crop images as needed. And, if you create a free Pickit account, you can mark favorites to reuse and follow fellow users or categories to stay up-to-date on new uploads.
8. Web Video Player
Maybe your company has videos on YouTube or tutorials on Vimeo that would be beneficial to your workbook. With the Web Video Player add-in, you can pop a video from either of these sources right into your spreadsheet.
Open the add-in and then either enter the URL of the video or click to visit YouTube or Vimeo to obtain the link. Hit the Set Video button and you are done. Then, when you open the spreadsheet, the video is there and ready for you to click the Play button.

For a one-time $5 fee, you can set your videos to play automatically or start and end at specific spots in the clip. This option is included within the add-in.
Find, Install, and Use Add-Ins
You can access the add-ins store easily from within Excel. Open a workbook, select the Insert tab, and click Store. When the Office Add-Ins Store opens, browse by category or search for a specific add-in. You can also visit the Microsoft AppsSource site on the web and browse or search there.
When you find the add-in you want, you can select it for further details or simply install it. However, it is wise to view the description first to check the terms and conditions, privacy statements, and system requirements.

After you install an add-in, open the Insert tab and select the My Add-ins button. When the pop-up window opens, you can view your installed add-ins and double-click one to open it. You can also click the arrow on the My Add-ins button to quickly select a recently-used one.

How Do You Make Your Data Stand Out?
Maybe you format your spreadsheets by hand or use completely different add-ins than those listed here.
Let us know what your preferred method is to make your data visually appealing in Excel by sharing it in the comments below.
Image Credit: spaxiax/Depositphotos