An Excel dashboard is a great way to show off the most pertinent pieces of data from a big, unwieldy spreadsheet. Whether it's for your own reference, or to pass on information to others, it's a great way of separating the wheat from the chaff.
In this guide, I'm going to produce a dashboard that will serve as a companion to my annual rewatch of the special Halloween episodes of The Simpsons. However, you can apply the same methods to anything from a workout planner to a sales report.
How to Create Your Dashboard in Excel
These three techniques will transform a standard Excel dashboard into a useful, aesthetically pleasing resource that will save you time and effort in the long run. The basic setup of any Excel dashboard is much the same. The standard is to use one or more sheets to do work behind-the-scenes so the dashboard itself is neat and tidy.
1. Add a Graph to the Dashboard With the Camera Tool
The Camera tool is very useful for our purpose. It makes it easy to display a section of another part of your spreadsheet exactly where you want it. We're going to use it to place a graph on our dashboard.
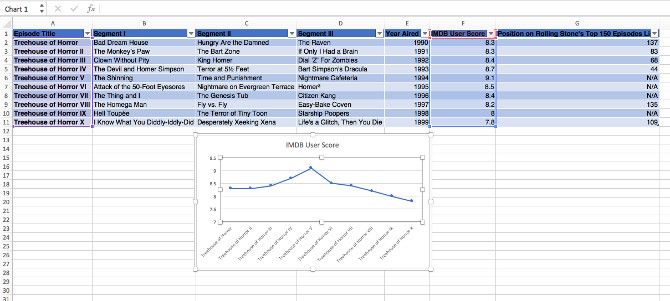
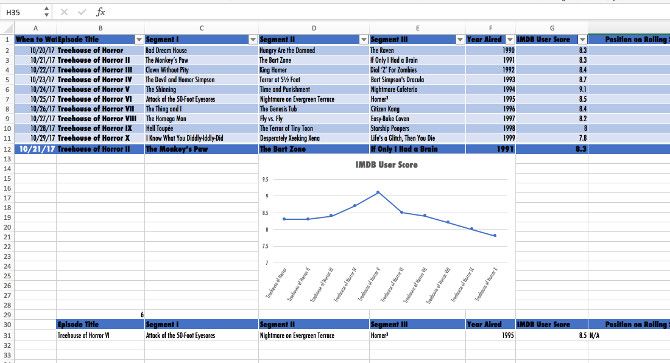
First, we need to set up our chart.
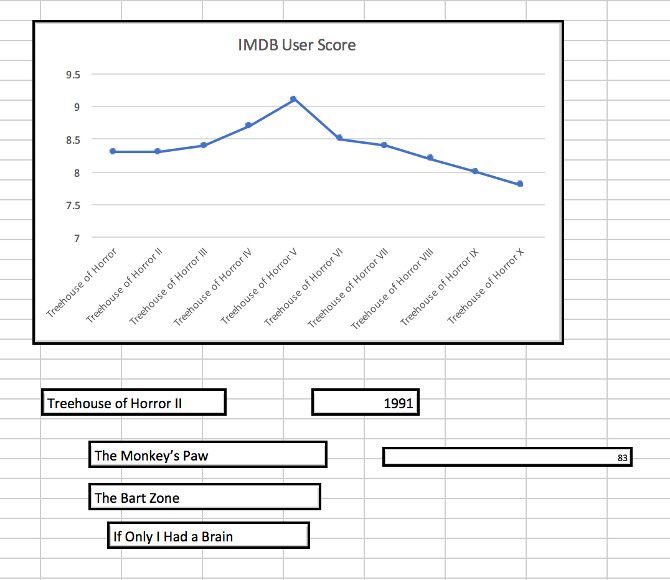
As you can see, I've kept things relatively simple for the time being. It just tracks the IMDB user score of each episode. Next, create another sheet called Dashboard if you haven't done so already.
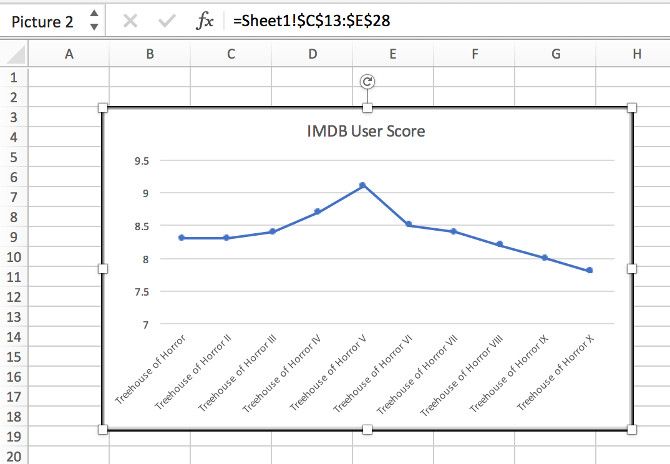
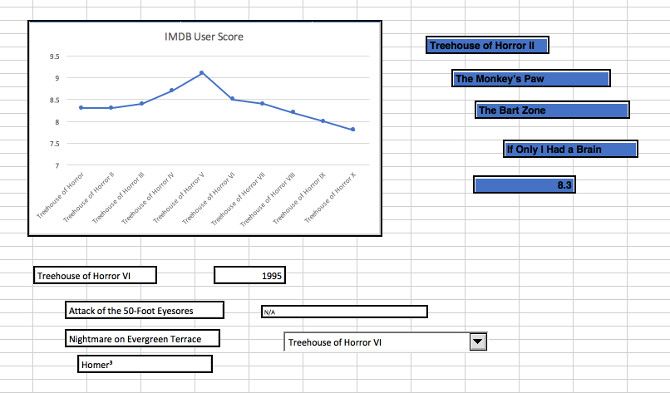
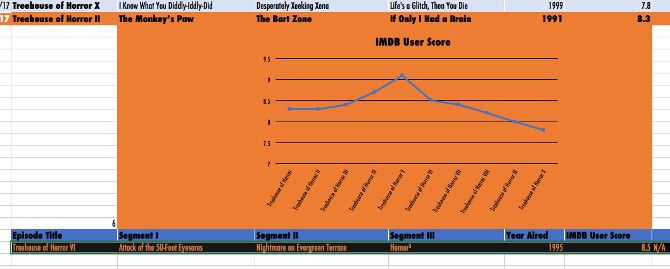
Next, select the area of your spreadsheet that contains your chart, and click the Camera button -- you may have to add it to the Quick Access Toolbar. Head to your Dashboard sheet and click where you want to place the chart.
You should end up with something like the above. There's no need to make any precise adjustments right now, just insert it into the Dashboard sheet. Once we have all our components ready, we can tackle our layout.
2. Implement a Dropdown Menu to Switch Between Items
The next thing I want to add to my dashboard is a dropdown menu that allows the user to select an individual episode, and see relevant details. A dashboard is meant to offer up information at a glance, so this is a good way to make sure that it's not overloaded.
Preparing Our Data
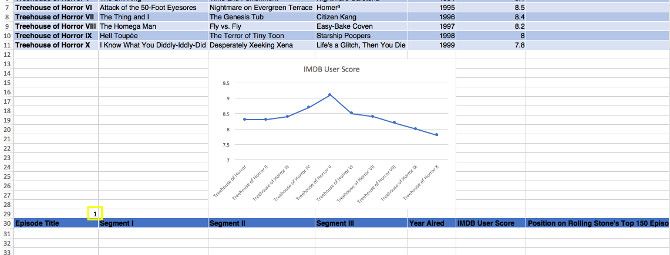
To set this up, we need to return to the sheet where we're keeping our data. Copy and paste the headers from your table further down the page.
You'll also see that I've added a 1 as a placeholder, highlighted in yellow. This will play a crucial role in the INDEX function we're about to add.
Copy this code into the leftmost cell under the table headers you just pasted.
=INDEX(A2:G11, $A$29, 0)
You'll need to make changes to reflect your spreadsheet. The first group of cells should cover all of your data, minus the headers. The second is the placeholder number we just added, and the third can be left as zero -- we're not specifying a column in this case.
Drag that formula out to fill the whole row.
Above, you'll see that I changed the placeholder number to a 2, and the cells repopulated with information from the second row of cells. This is the basis for our dropdown menu.
Adding Data to the Dashboard
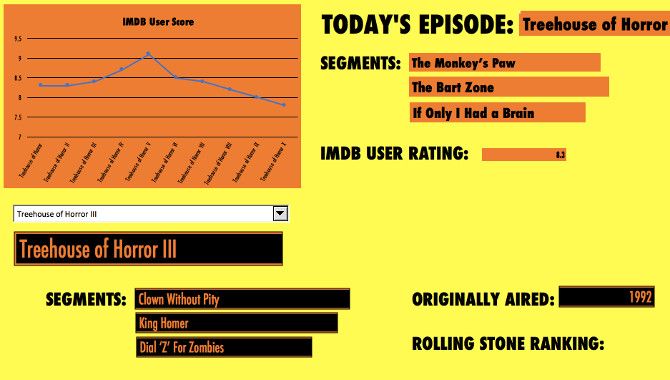
It's time to use our old friend the Camera tool. Select a cell with information you want to include on the dashboard, click the icon, then head to the Dashboard sheet and place it where it needs to be.
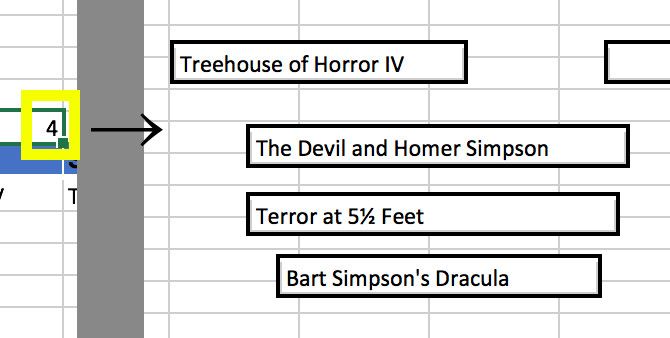
Again, there's no great need to make things look aesthetically pleasing just yet. We're concentrating on the skeleton of our dashboard for the time being. Head back to the sheet containing the data and change the number manually, to see if the values in the dashboard change.
My spreadsheet works just fine, so I'm going to move onto adding the dropdown menu.
Head to the Developer tab and choose the Combo Box.
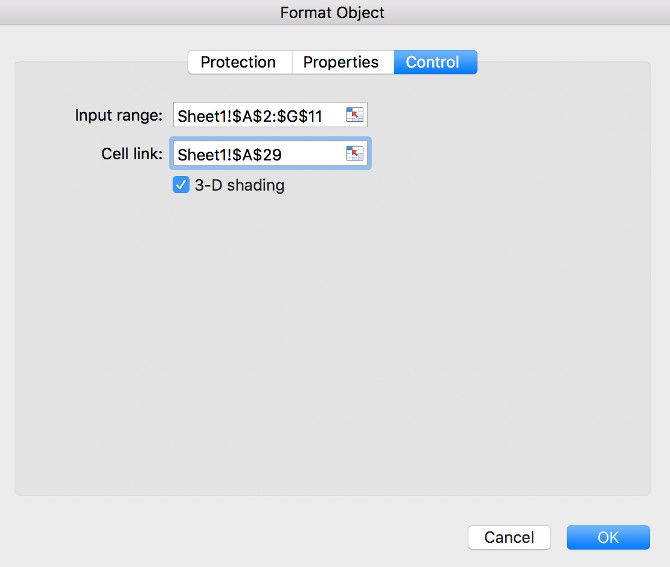
Place it wherever you like, then right-click it and select Format Control.
For the Input range, enter the range of cells you want to draw from, and for Cell link, enter the cell that we added a number to. In both cases, remember to add a reference to the sheet that they're on.
Your dropdown menu should now work as intended. Test it out.
3. Add a Schedule for Your Dashboard Tasks
Finally, we're going to add a simple way of scheduling tasks. Completing my Treehouse of Horror rewatch in time for Halloween means keeping to a strict schedule. I want my dashboard to automatically tell me exactly which episode I need to view on any given day.
To implement this, we're going to head to the sheet containing our data, and add a new column at the far-left of the document.
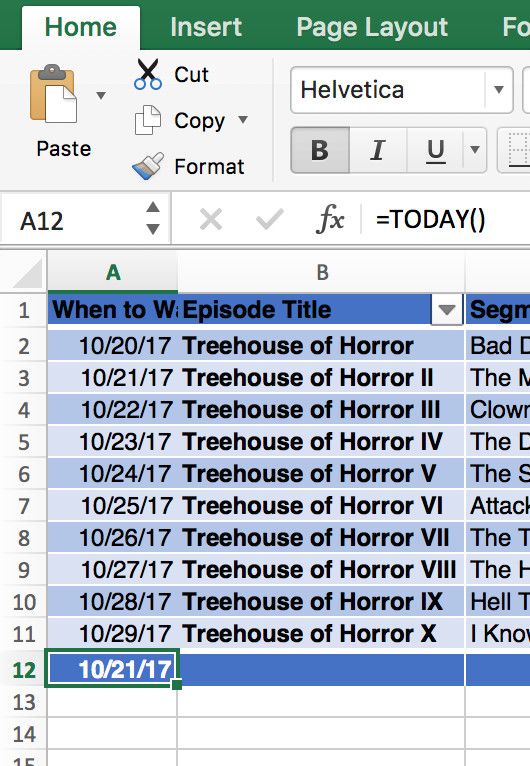
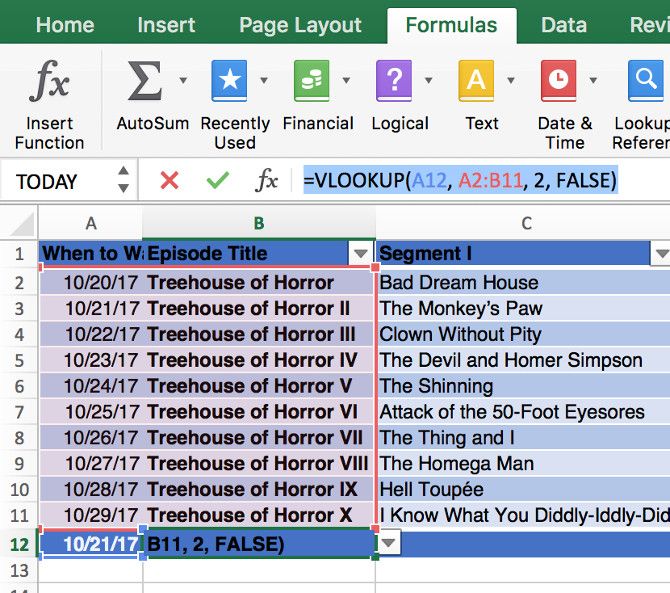
I've added the date that I plan to watch each episode. In another context, you might add the deadline for a particular task. At the bottom of the column, I've used =TODAY() to produce a cell that always displays the current date.
Next, I'm going to insert the following formula into the cell directly to the right:
=VLOOKUP(A12, A2:B11, 2, FALSE)
You can see how this looks below.
The first cell points to today's date, then the range of cells specifies where VLOOKUP should try find a match.
The number 2 dictates that the result should be drawn from the second column along, and FALSE confirms that we're only looking for an exact match.
This works great, so we're going to fill the rest of the row with the formula, then use the Camera tool once again to add this information to the dashboard.
Now we have a considerable amount of information to display on our dashboard. It's time to start tweaking the design.
Dashboard Design
This stage of dashboard creation is all about making your own aesthetic choices. However, it's important to remember that our finished product is meant to offer up information at a glance, so large fonts and contrasting colors are always a good idea.
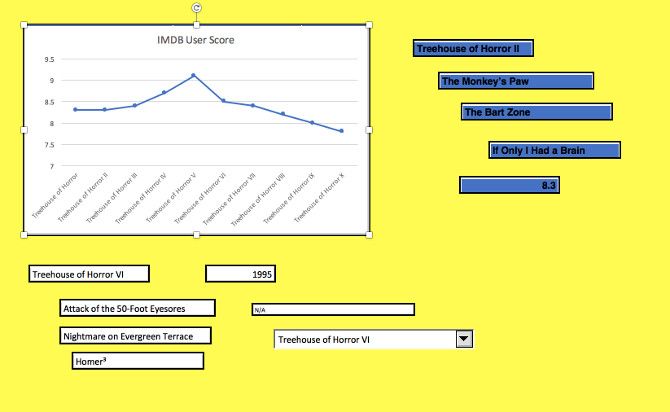
My first choice was to the Page Layout tab and untick the box marked Print under Gridlines. All our information is coming from another sheet, so the grid isn't particularly useful. I also used the Format Cells menu to change the background color to an appropriately Simpons-like shade of yellow.
This doesn't look particularly aesthetically pleasing just yet, but we're still very early in the process! Next, head to the data sheet so we can adjust the cells that are being served up on our dashboard. We're going to change colors and fonts over there, before heading back to the dashboard sheet to tackle layout.
My first move is to change all the text to a condensed version of Futura, a typeface commonly used by the show.
Next, I introduced a Halloween-themed black-and-orange color scheme that would contrast well against the yellow background.
At this point, I decided to return to the data sheet to tweak some cells. The ones containing a number or a year seemed a little too wide for the data in question.
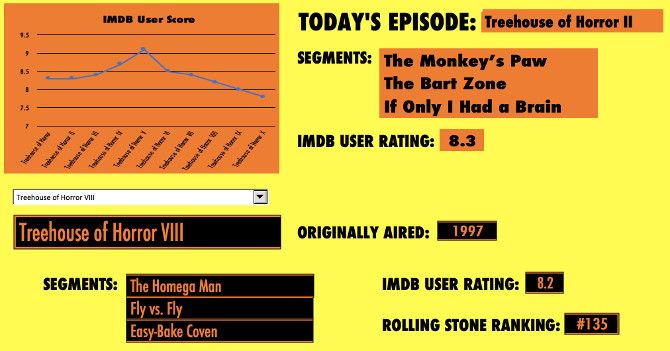
This is our finished dashboard. The top-right hand section will update based on the current date, and the lower section will change depending on the dropdown selection. It's clear, it's concise, and it offers up a good amount of information without being overbearing.
Try Your Own Take
The dashboard I've put together above is specifically designed for one particular purpose. However, the same techniques have a wide variety of different applications.
For example, understanding how to use the TODAY function in conjunction with other formulas can be used for various task scheduling purposes. Similarly, the Camera tool is about as flexible as it gets.
The key is establishing what your dashboard needs to do, and determining how Excel can facilitate that. It's a very powerful piece of software. The key is knowing what functionality does what.
Do you have a tip for producing Excel dashboards? Do you need a hand with a particular problem? Join the conversation in the comments section below.

