Python is widely used for data analytics, machine learning, web scraping, and much more. But did you know that you can also run Python code in HTML to build web applications?
PyScript makes it possible, allowing you to run Python code in a browser. Learn how to add matplotlib visualizations to a web page with the help of several PyScript-HTML examples.
What Is PyScript?
PyScript is an open-source web framework that lets you run Python in the web browser. It integrates the HTML interface and the power of Pyodide, WASM, and modern web technologies. PyScript is currently in the development phase but it has some exciting features already. Potentially, it could become a tool to create powerful web applications.
The code used in this project is available in a GitHub repository and is free for you to use under the MIT license. If you want to have a look at a live version of this project, you can check out the lineplot and barplot demos.
Set Up HTML Boilerplate
Before using PyScript, you need to set things up. Create a new HTML file and set up the HTML boilerplate. Most modern IDEs provide the functionality to create boilerplates automatically. You only need to type doc or html and hit enter. You can also use the following template to get started:
        <!DOCTYPE html>
<html>
    <head>
        <meta charset="utf-8">
        <meta http-equiv="X-UA-Compatible" content="IE=edge">
        <title></title>
        <meta name="description" content="">
        <meta name="viewport" content="width=device-width, initial-scale=1">
    </head>
    <body>

    </body>
</html>
Add PyScript to HTML: "Hello, World!" Using PyScript
You can use PyScript in your HTML file by either downloading it or linking its CDN in your HTML head. Add the following in the <head> section of your HTML file:
        <link rel="stylesheet" href="https://pyscript.net/alpha/pyscript.css" />
<script defer src="https://pyscript.net/alpha/pyscript.js"></script>
That's all you need to do to set up PyScript.
To verify if PyScript was successfully integrated, add the following line of code in the <body> section:
        <body>
    <py-script>print("Hello, World!")</py-script>
</body>
Open the HTML file in any web browser and you'll see Hello, World! printed there.
Load Matplotlib Library
You need to use the <py-env> </py-env> tags to import Python modules. Load the matplotlib module in the <head> section of your HTML file using the following snippet:
        <py-env>
        - matplotlib
</py-env>
Display a Line Plot in the Browser Using PyScript
Create a <div> with an id. You'll need the id to use it with the output attribute of the <py-script> tag.
<div id="matplotlib-lineplot"> </div>
You need to write the Python code in the <py-script> tag. Assign the above id to the output attribute of the <py-script> tag.
        <py-script output="matplotlib-lineplot">
        # Python Code
 </py-script>
You're now ready to write the Python code to create a line plot:
            <body>
        <div id="matplotlib-lineplot"></div>
        <py-script output="matplotlib-lineplot">
            # Python Code

            # importing the matplotlib library
            import matplotlib.pyplot as plt
            fig, ax = plt.subplots()
            # x axis
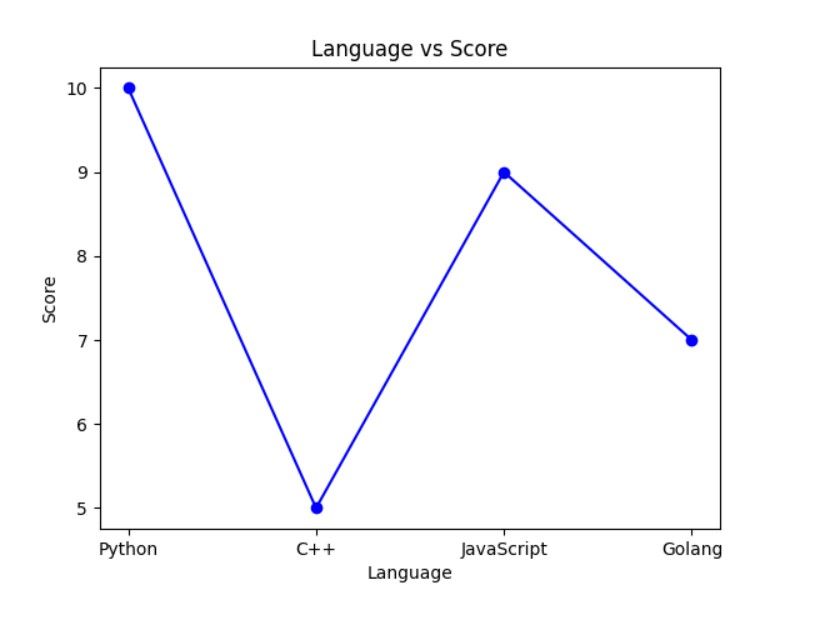
            x = ["Python", "C++", "JavaScript", "Golang"]
            # y axis
            y = [10, 5, 9, 7]
            plt.plot(x, y, marker='o', linestyle='-', color='b')
            # Naming the x-label
            plt.xlabel('Language')
            # Naming the y-label
            plt.ylabel('Score')
            # Naming the title of the plot
            plt.title('Language vs Score')
            fig
         </py-script>
    </body>
You'll get the following figure rendered when you'll open the HTML file in the web browser:
Display a Bar Plot in the Browser Using PyScript
You can create a bar plot in the browser using the following Python snippet:
        <body>
    <div id="matplotlib-bar"></div>
    <py-script output="matplotlib-bar">
        # Python Code

        # importing the matplotlib library
        import matplotlib.pyplot as plt
        fig, ax = plt.subplots()
        # x axis
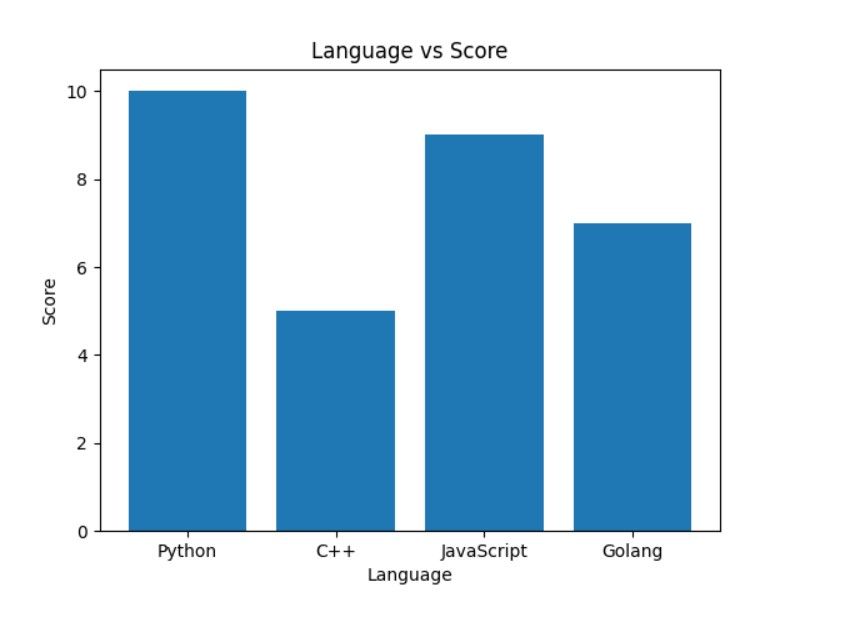
        x = ["Python", "C++", "JavaScript", "Golang"]
        # y axis
        y = [10, 5, 9, 7]
        plt.bar(x, y)
        # Naming the x-label
        plt.xlabel('Language')
        # Naming the y-label
        plt.ylabel('Score')
        # Naming the title of the plot
        plt.title('Language vs Score')
        fig
     </py-script>
</body>
This code produces the following output:
What Future Does PyScript Hold?
You can build powerful dashboards and charts in HTML using PyScript and Python libraries like Matplotlib, Bokeh, Seaborn, and so on. However, you should probably hold off from using it in production as it’s under heavy development. The software currently has multiple issues including loading time and usability. In the future, PyScript may open gates to run and perform Python operations on the web more smoothly.
One of the main reasons to develop PyScript was to help data scientists visualize data on the web. If you're a data scientist, you can leverage the power of PyScript by combining it with data science libraries like Pandas, and NumPy.


