Anyone who's on the lookout for a data visualization or Business Intelligence tool knows that Microsoft Power BI and Tableau are the best options out there.
Both tools appear pretty well-matched at first glance. However, dig a little deeper, and differences giving one an edge over the other become apparent. Let's find out which tool is optimal for a user who is uncertain about which way to swing.
Tableau: Overview
Tableau is easy to use, and though some prior knowledge of data analysis would help, it's not necessary. If you don't have any, you can still get started with Tableau right away.
Tableau helps you create interactive visuals. It enables you to organize and analyze data and make it easily digestible with the help of an array of visual aids. It even has a drag-and-drop feature for extra convenience.
If you don't need to dazzle with visual aids, Tableau could be too much for you. If you just need to generate uncomplicated reports, Microsoft PowerBI would be a better option.
Microsoft Power BI: Overview
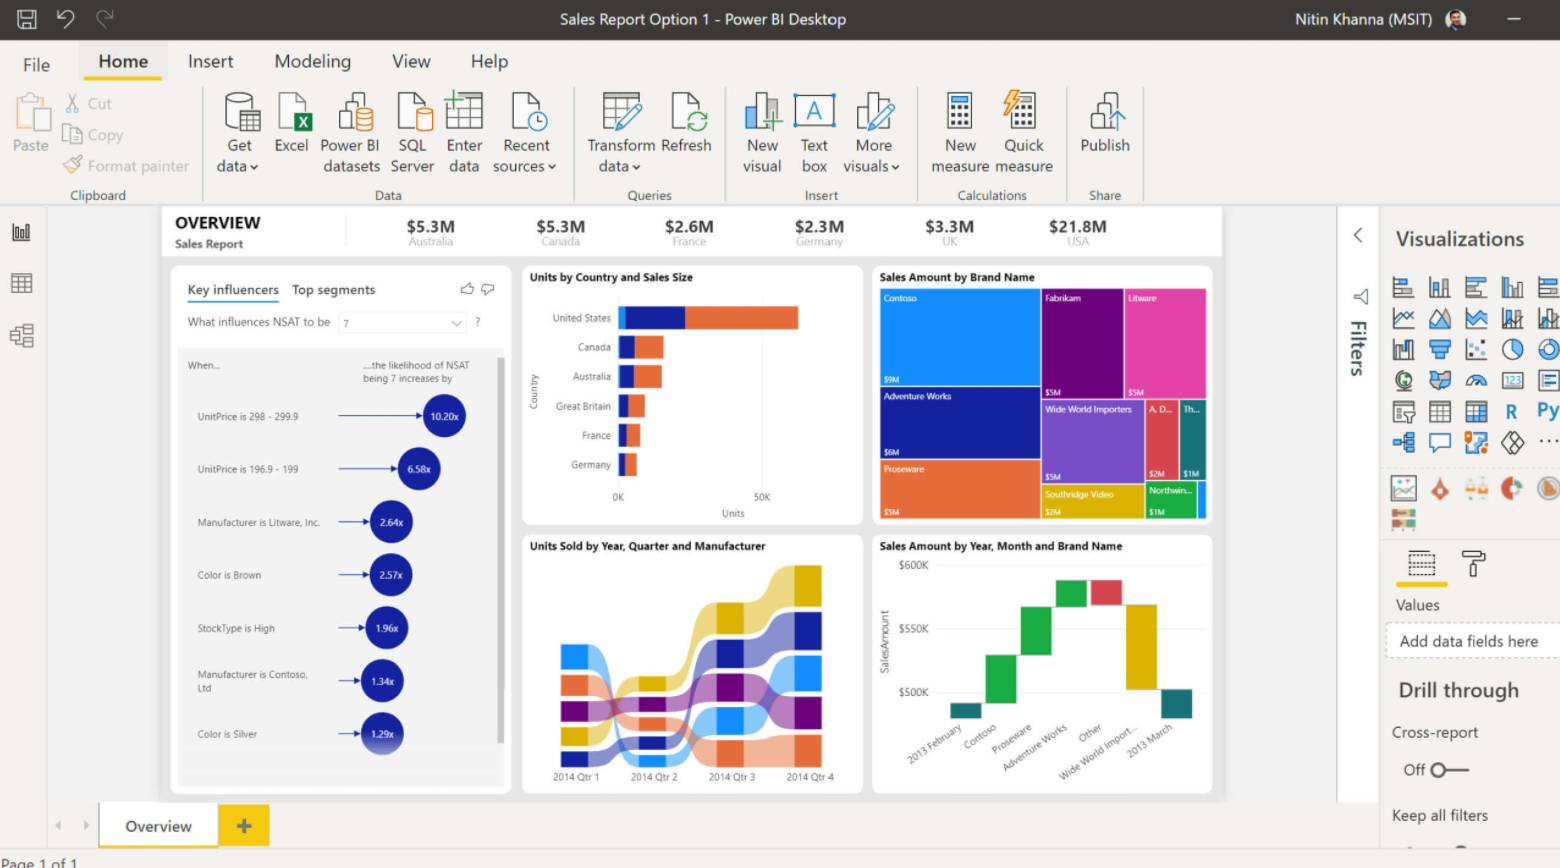
Microsoft Power BI is a cloud-based analytics and business intelligence platform. It has a drag-and-drop feature like Tableau and makes data sharing a simple and easy process. Microsoft Power BI shines when it comes to creating and displaying basic dashboards and reports.
What gives Microsoft Power BI an advantage over Tableau is that it comes with the Microsoft stack behind its back. That integration is a huge selling point. The tool comes included in Office 365, but it can also connect to external sources.
Visualizations
Tableau helps you create various baseline visualizations, like line charts, heat maps, and scatter plots, among others. It enables you to craft intricate and sophisticated visualizations.
One of the great things about Tableau is that it allows you to ask “what if” questions of the data and use any number of data points in your analysis.
The Microsoft Power BI tool allows you to upload data quickly and create visualizations using natural language queries. You can create as many visualizations as you want as blueprints and then insert data into each visualization you're working on.
The downside to Microsoft Power BI is that it only has 3,500 data points. Tableau does not have that, and for that reason, it comes out on top in this round.
Winner: Tableau
Customer Support
Tableau offers direct support by phone and email whenever you need it. You can also submit a support ticket through its customer portal.
Additionally, Tableau offers a variety of support resources you can find online, as well as courses and training seminars you can attend. There is a community and a forum, which you can utilize when needed.
Microsoft Power BI doesn't charge for customer support functionality, but experienced users say it's faster if you have a paid account.
Although you can get help regardless of your account status, Microsoft Power BI also produces various support resources, courses, guided learning, and a community with a forum.
Winner: It's a tie!
Ease-of-use
Microsoft Power BI works better for the general public, while Tableau is the preferred tool of data analysts. Both are user-friendly, and there's not much of a learning curve to them. However, since Tableau caters more so to data analysts, it might take you a bit longer to figure out how to best work it.
In contrast, Microsoft Power BI is perfect for complete beginners. You don't need any previous knowledge to use it. No courses or previous experience in data analysis are required.
While Tableau is easy to learn, it would benefit from a bit of data analysis experience. The good thing is, with all the available resources available, it won't be long until you are transforming data into complex visualizations.
Winner: Microsoft Power BI
Cost
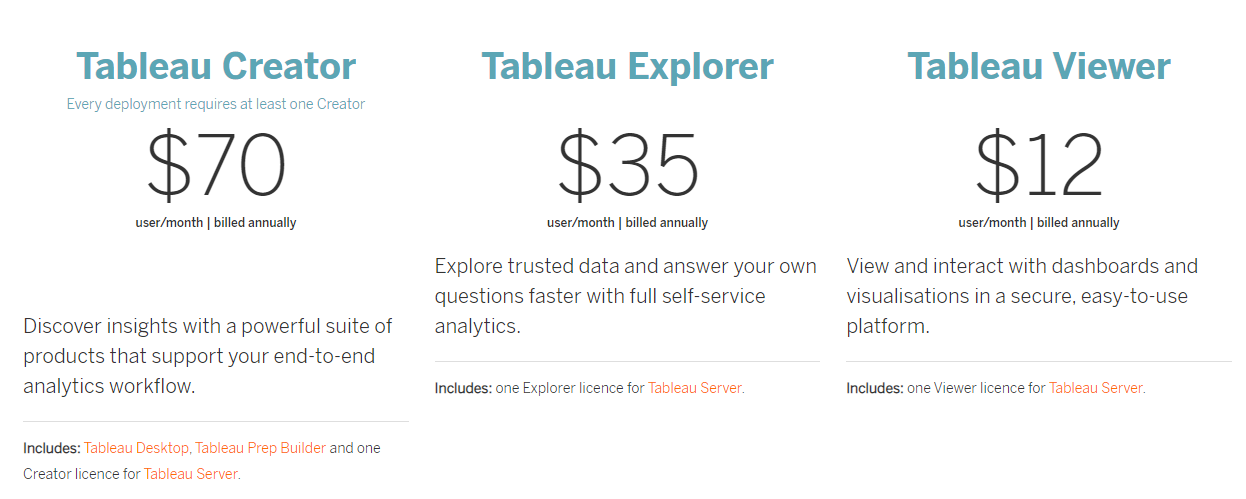
Both Microsoft Power BI and Tableau offer a tiered pricing system. Tableau has three subscription options you can choose from, designed to cater to different needs. You have the Viewer, Explorer, and Creator plan.
Prices vary per user, per month, and whether you get billed annually. Cost also gets affected based on whether you deploy the Tableau platform on-premise or in the cloud.
Tableau offers a 14-day free trial, so you can scope everything out and make sure it's right for you before you commit any money to it. It is a great tool, but make sure it's truly worth the money you're paying for because the price can really add up.
The Tableau Viewer plan costs $12 per user per month if you deploy it on-premise. If it gets hosted on Tableau's cloud, it's $15/user/month. It lets you access already-created visualizations, and you have to have at least 100 viewers get the plan.
The Explorer plan is $35/user/month for on-premise deployment and $42/user/month for cloud deployment. Finally, the Creator plan gets you the full Tableau functionality for the price of $70/user/month, and it doesn't matter if the platform gets deployed on-premise or in the cloud.
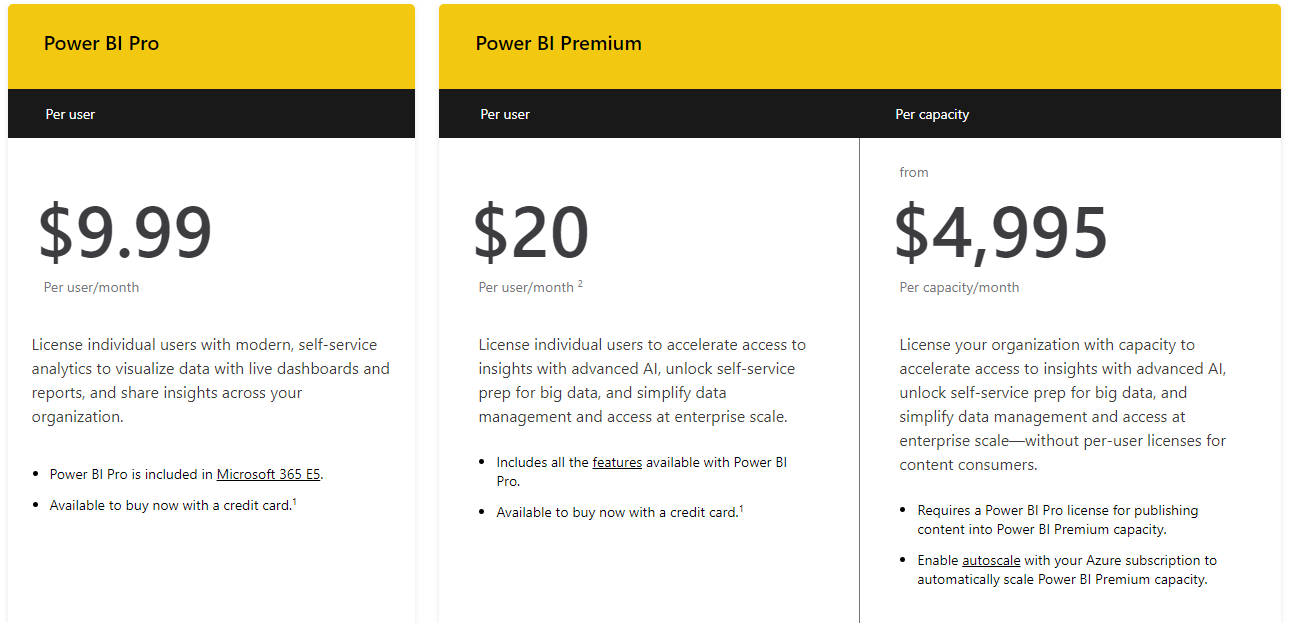
Microsoft Power BI also offers three levels of subscription, with one of them being free. You get Desktop, Pro, and Premium. The Desktop level is free for individual users, and the Pro plan starts at $9.99/user/month.
Among other things, it gets you a 1GB model size limit, and you can do 8 data refreshes every day and connect to over 100 data sources. If your company already has the Microsoft 365 E5 solution, you can access the Pro plan for free. Also, you can test the Pro plan for a full 60 days, which is longer than Tableau's 14 days free trial.
You can subscribe to the Premium plan for $20 per user, per month. You get all the features in the Pro plan, plus the ability to use up to 100GB per model, and 48GB of storage on average.
You also have the option to get the Premium per capacity plan, which starts at $4,995 per month per dedicated cloud compute and storage resource.
This plan gives you a 400 GB model limit along with a number of other features. Much like Tableau's plans, you should take care of either plan, making sure it suits your needs.
Winner: Microsoft Power BI
Which One Should You Choose?
Determining a clear winner is a challenge. One is better for data analysts and the other for novices. One is more affordable but offers less functionality than the more expensive all-in-one platform.
The decision here comes down to your business' needs and scale. What will you use it for? If you want to dazzle with complex visualizations, use Tableau. Otherwise, Microsoft Power BI is better for something simple.
If you're still uncertain at the end of the comparison, Encore offers another way to choose. Their recommendation tool asks you questions to help you determine which tool is best for you: Tableau or Microsoft Power BI.


