A productive data visualization and analytics tool should offer a unique set of essentials to win over users. Among others, that includes powerful features, fair price, and user-friendliness.
Microsoft Power BI and Tableau are among the most prominent and widely used data visualization and analytics tools at the moment. But which one comes out on top? Let's compare the two and figure that out.
What Is Power BI?
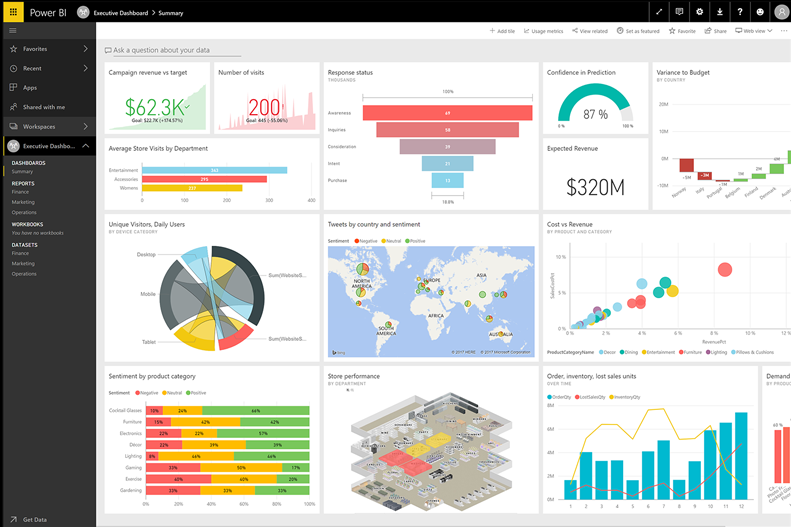
Microsoft Power BI is a business analytics tool that transforms data from different sources into useful business intelligence reports. The data analytics tool performs a detailed analysis of information and grants you a tabular and graphical display of data in dedicated dashboards.
It also updates these dashboards automatically and in real-time. You can use Power BI to create custom content packs for a single team or the entire organization. That includes reports, datasets, and dashboards.
Power BI benefits from the company it's part of---Microsoft. It uses the existing Microsoft systems (Azure, SQL, Excel) and builds data visualizations that don't break your budget. So, if you already use Microsoft products like Office 365 and Excel, Power BI might be better suited for you.
It's well-priced for what it offers, and a lot of startups and SBMs (Small Medium businesses) that don't have a massive budget to spend could truly benefit from the tool.
What Is Tableau?
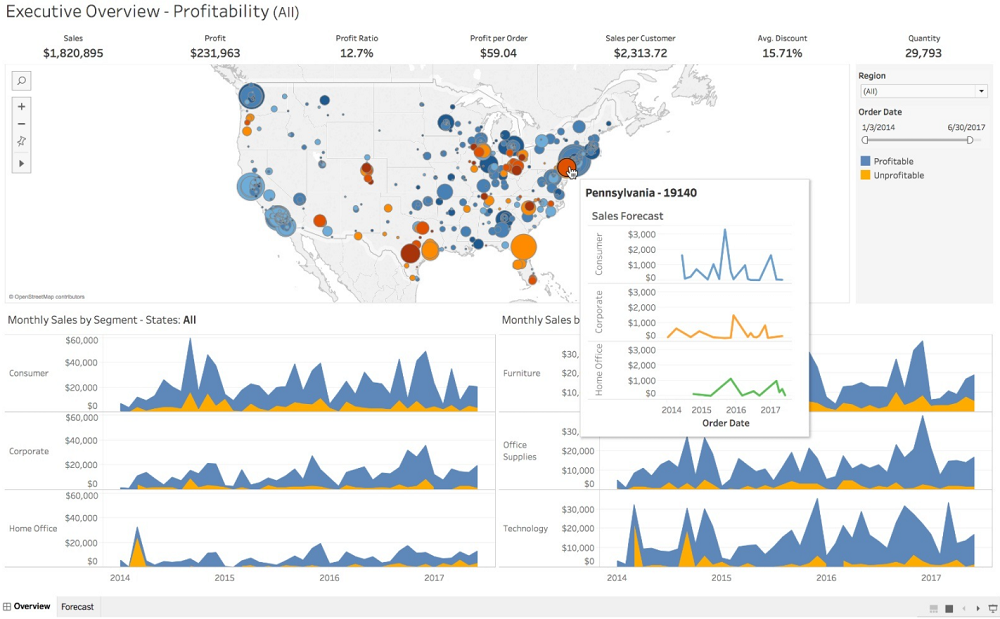
Tableau is a data analytics platform that offers data visualization. It's a powerful tool that allows you to create graphs, charts, and visualizations in general. It also provides a useful image-sharing tool.
Users have the ability to share or publish their visualizations on the server for other people to see and also benefit from an array of data sources. Among others, that includes databases, cloud systems, and even Excel.
In contrast to Power BI, Tableau seems to cater to the other side of the clients' spectrum. Their advertising focuses on corporate environments with bigger budgets. The tool does offer a free version, but the more features you want to access and use, the more you have to pay.
Microsoft Power BI: Price
Both tools offer a free trial version, but if you want to benefit from the bulk of their features, it will cost you.
Power BI is much cheaper than Tableau. As mentioned, Tableau has a lot of its most useful features behind a paywall, so even if you use its free version, you'll be getting much fewer features.
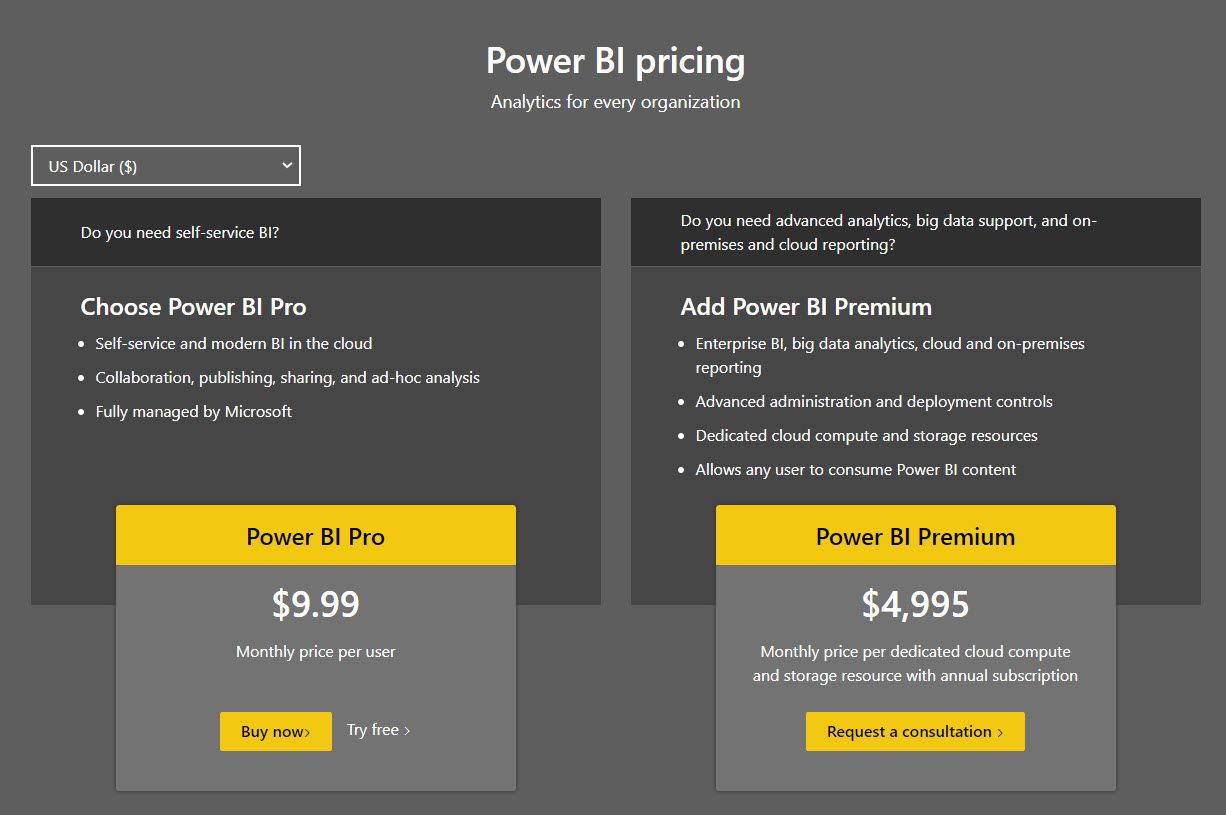
Microsoft Power BI offers two paid options: Power BI Pro and Power BI Premium. The former has a free trial period. The latter offers more features like more storage, larger individual datasets, and so on.
The cheaper version is licensed per user, while the premium one gets licensed by dedicated cloud compute and storage resources. So, it's a better alternative to avoid buying an array of single-user licenses.
On the opposite end, if you have only a few users who need access to the Power BI features, it makes more sense to pay per user.
Power BI's integration with the Microsoft ecosystem gives it an edge and pushes it into affordability. Especially, if you already pay to use other Microsoft products.
Tableau: Price
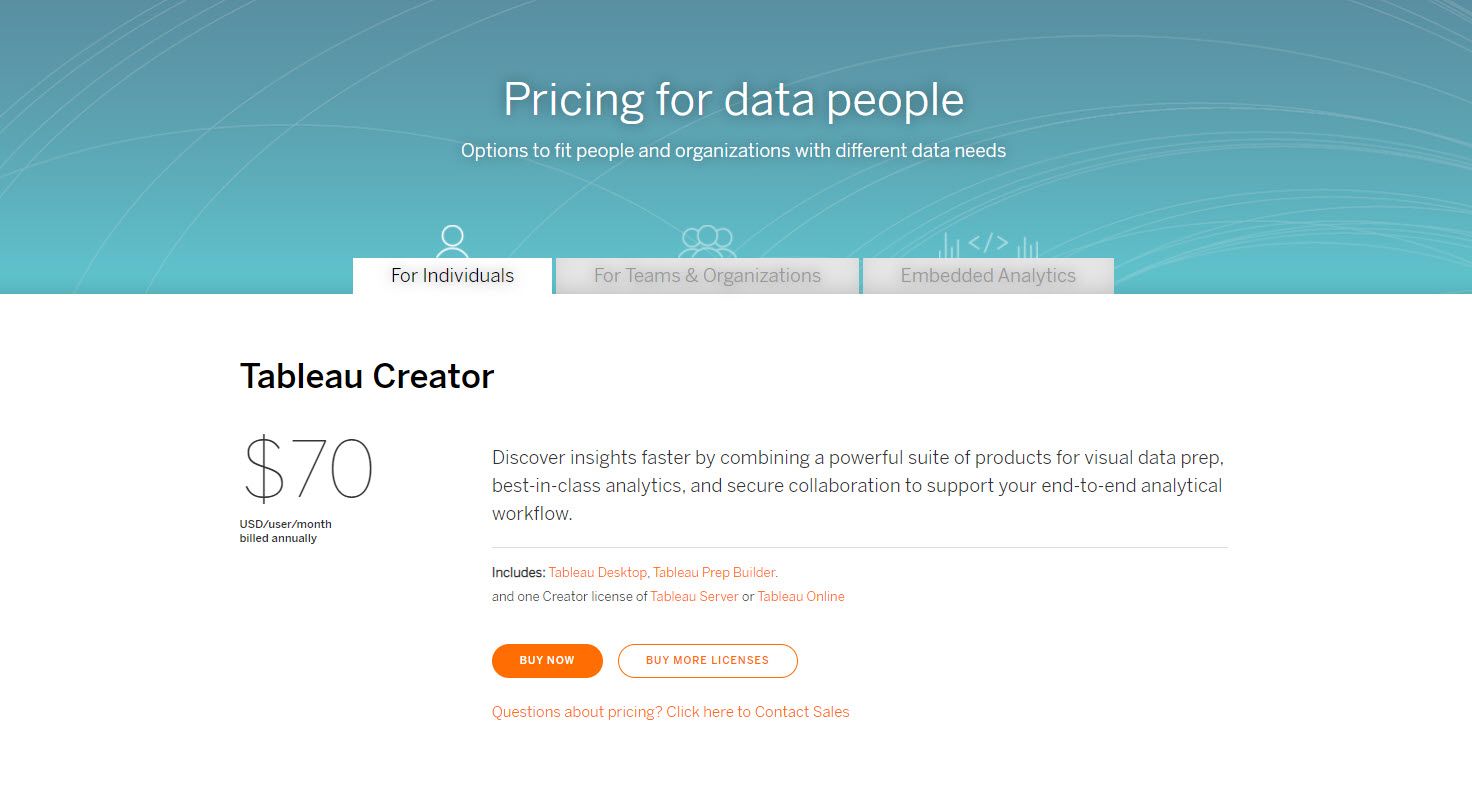
Tableau has different pricing for individuals, teams, and organizations, making its pricing seem a bit more chaotic than that of Power BI. Payment is subscription-based, and it uses a tiered system that distinguishes between connections to files and third-party apps.
That means if you have data in spreadsheets and want to export it from third-party tools before uploading to Tableau, it's relatively well-priced if you pay per user. But if you want direct connections to your third-party apps (Google Analytics, Microsoft products, Marketo, Hadoop), you have to pay up for the Professional edition.
Before deciding on either tool, you should consider what your exact needs are. What features are you going to use most of all? How many users are going to need licenses? Are you going to use third-party apps?
Answer all these questions and decide what tool is best for you. If you don't weigh your options carefully, you might end up overpaying.
User-Friendliness
Tableau is the better tool if you're a data analyst. Power BI is better for the general public.
Power BI isn't only for data analysts but also for the amateur. Intuitive features combined with drag and drop help teams build their visualizations without complex steps.
The Microsoft Power BI tool is an excellent addition to any team that needs data analysis without forcing them to go through a course or get experience in data analysis first.
Tableau is as powerful but not as intuitive as Power BI. It does take a while to learn how to use it and get used to it. A prior experience with data analysis helps, and even if you know the basics, you'll have no issues cleaning and transforming data into visualizations.
Integrations
Both tools offer integrations. Power BI has API access and pre-built dashboards that allow insights for some of the most widely used technology out there, including Microsoft products, Google Analytics, Salesforce, and email marketing.
It lets you download files to build your visualizations, as well as connect to services within your organization. If you want to link data to Power BI, all you have to do is use the Get Data button and go through a short authorization process. It's pretty straightforward.
Tableau allows integrations and connections to big tools and widely used connections. If you don't know the connections included with your account level, you can check them out as soon as you log into the tool and see what you have to work with at your disposal.
In Tableau, if you want to connect and pull data into the tool, you first need to determine which data you want to pull. So, it's best to sort that out before you start making connections. The process may seem a little more complicated than what Power BI requires, but it's still relatively simple.
Power BI: Features
Power BI offers real-time data access, as well as drag and drop features to make your life easier. The real-time data access allows teams to react instantaneously to business changes fed to Power BI from the CRM, financial, sales, and project management tools.
The tool is built to speed up time to visualizations. It helps you access powerful data analytics and discovery, as well as support for native apps that let you access data from anywhere and give alerts about changes. You can also add your visualizations straight to your blog or website by using the publish to web feature.
What makes Microsoft Power BI stand out from Tableau is that it offers you access to the natural language query tool. It acts as Google but for your data. You ask it questions regarding the data, like "How much do we invest in each customer?" and it answers. Tableau doesn't offer an alternative to Power BI's natural language query tool.
Tableau: Features
Tableau stands pretty much neck and neck to Power BI when it comes to features. It offers tools that are just as powerful but falls behind a bit in terms of their intuitiveness.
Tableau provides you with live query capabilities and extracts. Its interface uses a drag and drop table view to ask questions of the data. As long as you provide your data types in the x and y axes, Tableau builds your visualization instantly.
Tableau also allows you to access and manipulate data through the mobile app, as well as grants you the option of entire teams collaborating around shared dashboards.
Customer Support
If you find yourself lost with Power BI, you can turn to the customer support tool and find assistance. You'll have access to guided learning and documentation, webinars, and if that doesn't help with your issue, you can always go to the Power BI YouTube channel.
Tableau also provides support tools that can help teach you everything you need to know, starting from the basics of setting up the software all the way through initial data analysis.
Power BI vs. Tableau: Which Comes Out on Top?
To answer that question, you must first know who will be using the data analytics tool and services to build and publish visualizations. Both tools are powerful and offer a great selection of features.
Power BI takes the lead for user-friendliness, but Tableau wins in speed and capabilities. Power BI is more budget-friendly, especially if you're already using and paying for other Microsoft products. It's also better for small businesses, while larger companies with the budget for it might fare better with Tableau.
Ultimately, there's no clear winner. Each tool has its pros and cons and fits different needs and requirements. To find which one would suit you best, discover what your needs and requirements are.


