Looking for a better way to display data in your PowerPoint presentation and take your slides to the next level? Now you can with these new Power BI integrations.
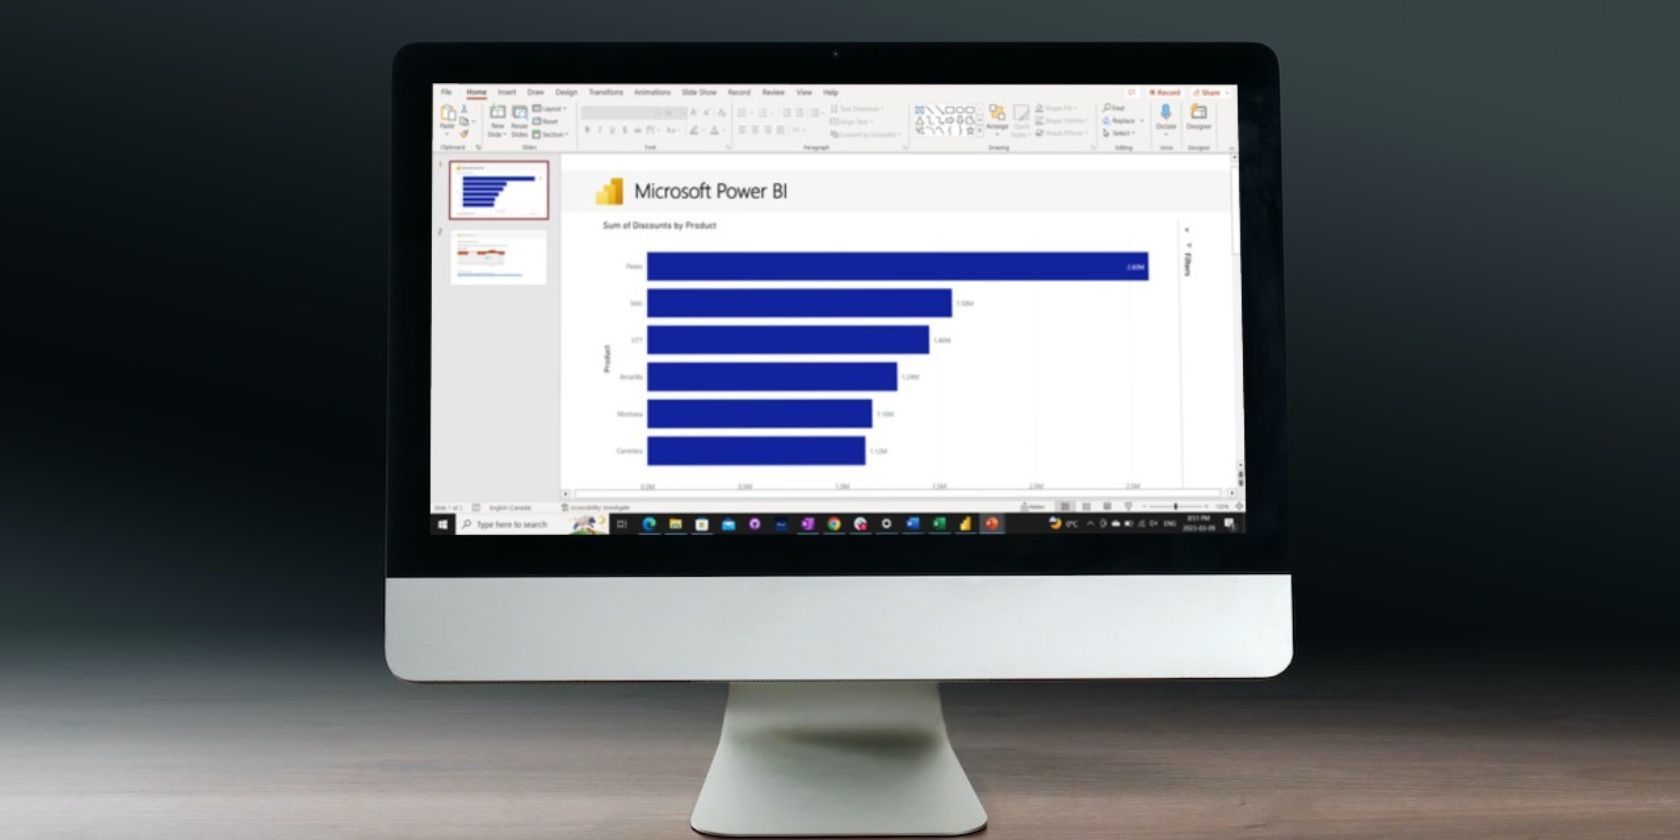
On March 6th, 2023, Microsoft released a new add-in for PowerPoint that will connect to your Power BI reports. You can now add single visuals to your report and use the Smart Insights tool to make your presentations more informative and increase productivity.
Inserting Visuals Into Your PowerPoint Slide
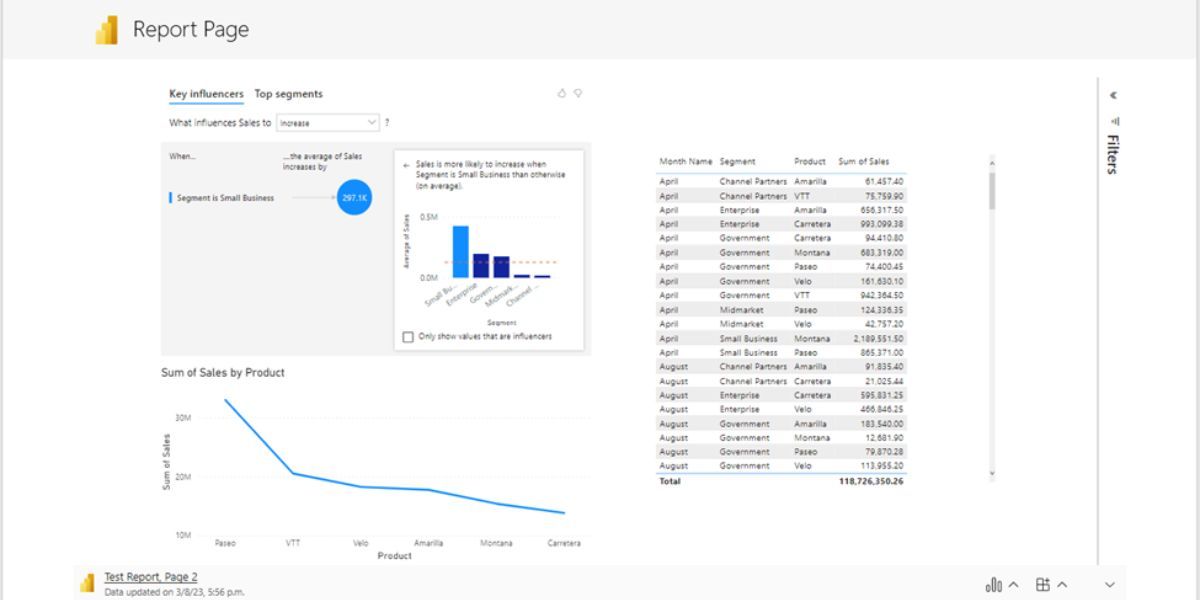
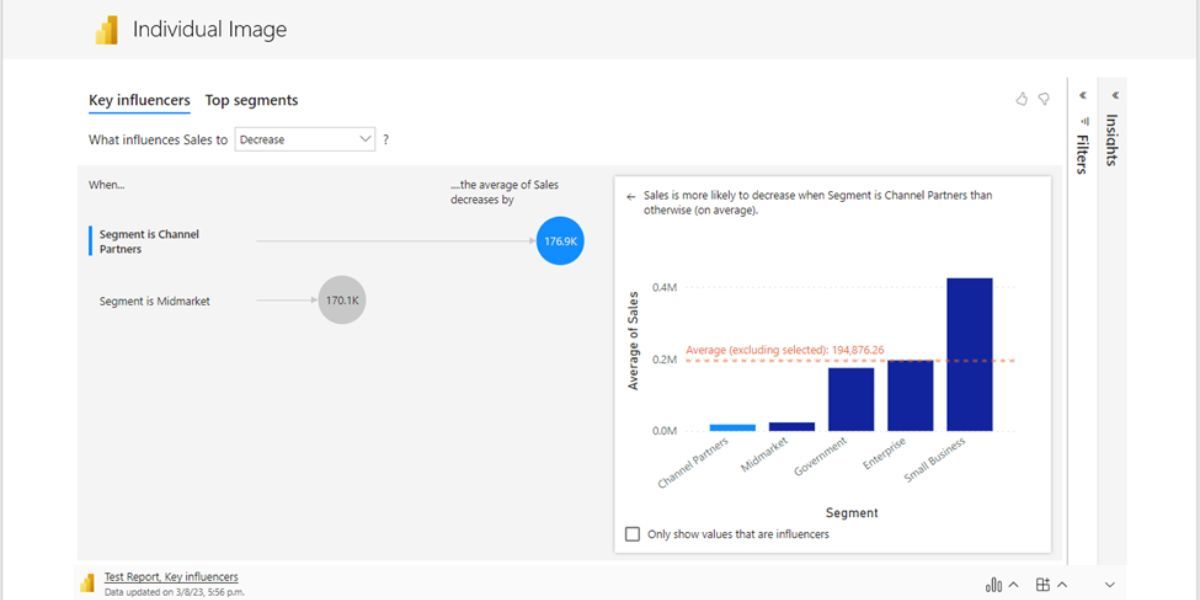
This new feature lets you put an individual visual or a full page from your Power BI report into a PowerPoint slide. There are plenty of add-ins to make your presentations more interactive. In this case, combining one of the most powerful data visualization tools with PowerPoint will make your presentations more informative and engaging.
Here are its main benefits:
- Power BI data is live and will always be up-to-date.
- You can drill down and filter the data from PowerPoint, making answering questions during presentations easier.
- There's no need to recreate charts or use screenshots; import them directly into the slides from your already made report.
- Import individual visuals or full report pages
How to add a Power BI report or visual:
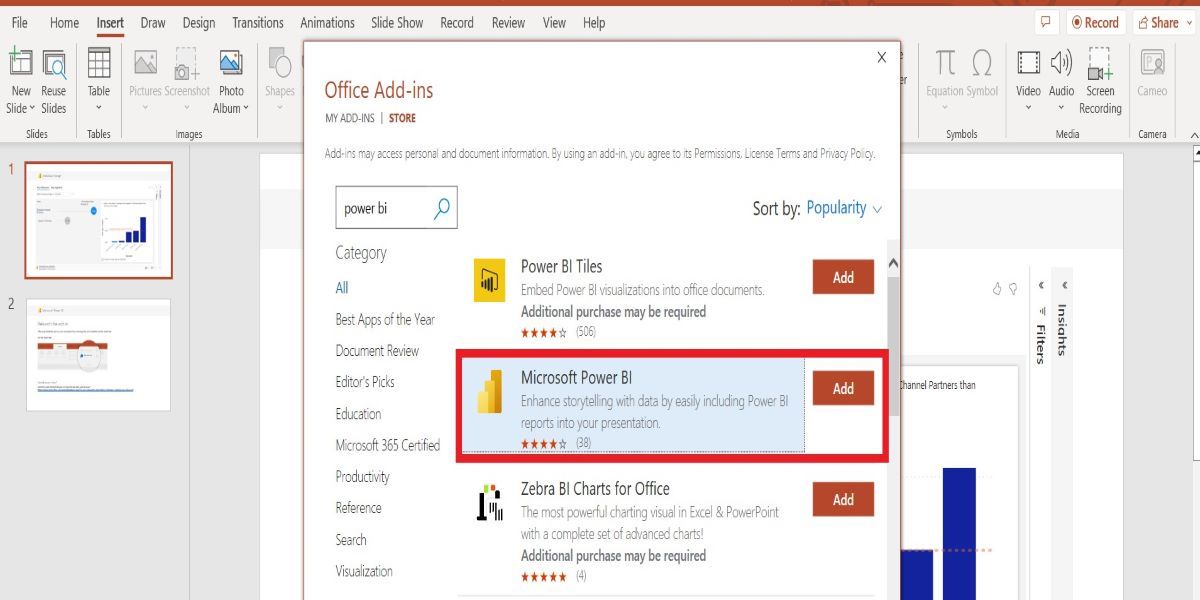
- In PowerPoint, under the Insert tab, click on Get Add-ins. In the pop-up's search bar, type "Power BI" to find the add-in. Add the one titled "Microsoft Power BI."
- To access this add-in, use the My Add-ins button on the Insert tab.
- When you select the button, it will ask for a link to the report or diagram you want to add to the slide. To get this go to Power BI, select the three dots on the specific visual or page, and choose Share in PowerPoint. Then, copy the report URL and paste it on the presentation slide. You can also share the live report or visual from the Power BI service to PowerPoint with the Share button.
Increase Productivity With the Smart Insights Feature.
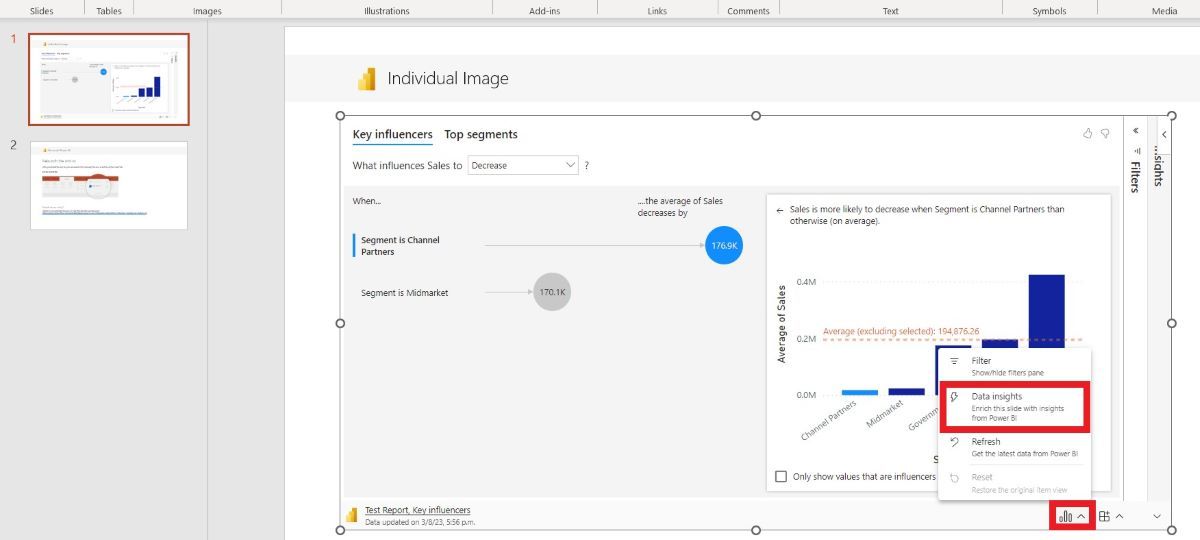
This tool analyzes the charts and gives you insights into the data. Not sure what to call out? The Smart Insights feature will do it for you. To add, click the three bar icon on the visual and choose Data Insights. Here are some of the key benefits:
- Generate text to summarize data quickly.
- Easily create compelling stories.
- It helps explain data and highlight key insights.
- It can be used on individual visuals and full report pages.
- Save time on your presentations.
Integrated Features Coming Soon to Power BI
In addition to the features above, Microsoft is currently working on these features for PowerPoint & Power Bi:
- Present files in PowerPoint live in teams from the PowerPoint app.
- Integrate Power BI into Microsoft Teams meetings.
- Optimize pre-sets in Power BI Desktop.
Improve Your PowerPoint Presentations With Power BI
From having the flexibility to filter data while presenting to quickly generating insights and explaining data, your slides will be more interactive and informative with Power BI. When your data is well tabulated, you can focus on making your presentation more impactful with it.

