Pivot tables in Excel are pivotal in making data easier to understand and comprehend. A pivot table can condense and crunch data into meaningful structures. MS Excel users have widely adopted them within the data industry.
Did you know you can automate your pivot tables in Excel and create them with a single click? MS Excel integrates well with VBA and has become an excellent tool for automating repetitive tasks.
Here's how you can automate a pivot table with a macro in MS Excel VBA.
Use a Practice Data Set
You can download and use a dummy dataset from Tableau to follow the VBA script within this guide. The VBA code will work with any other dataset, with a few basic tweaks. Before starting, do ensure you have enabled macros within your Excel workbook.
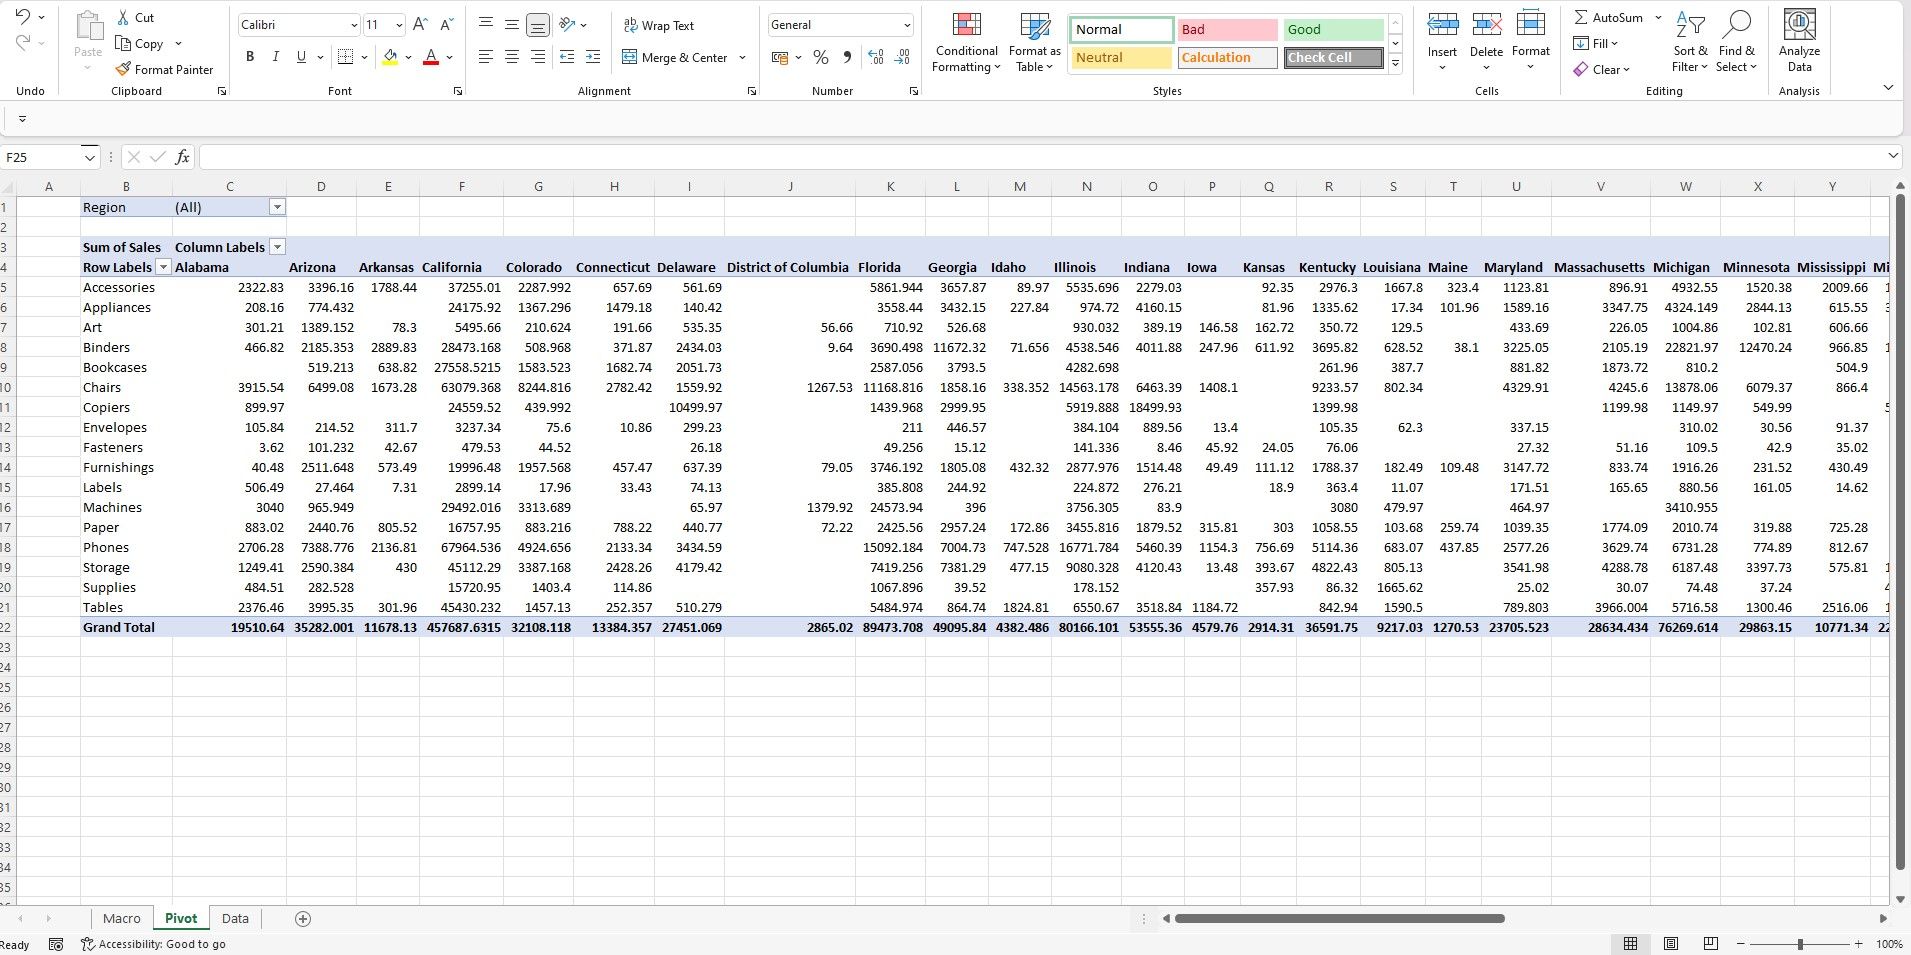
There are a few essential columns that you can use within the pivot table. To understand the table's nuances and final structure, you can create a basic pivot table manually with the following elements:
- Filter: Region
- Rows: Sub-Category
- Columns: State
- Values: Sales
The end pivot should look as follows:
However, you can let VBA do it automatically instead of preparing it manually.
How to Automatically Create Pivot Tables in Excel
To automate your pivot tables with VBA, open a new Excel file, and rename the sheets as follows:
- First sheet: Macro
- Second sheet: Data
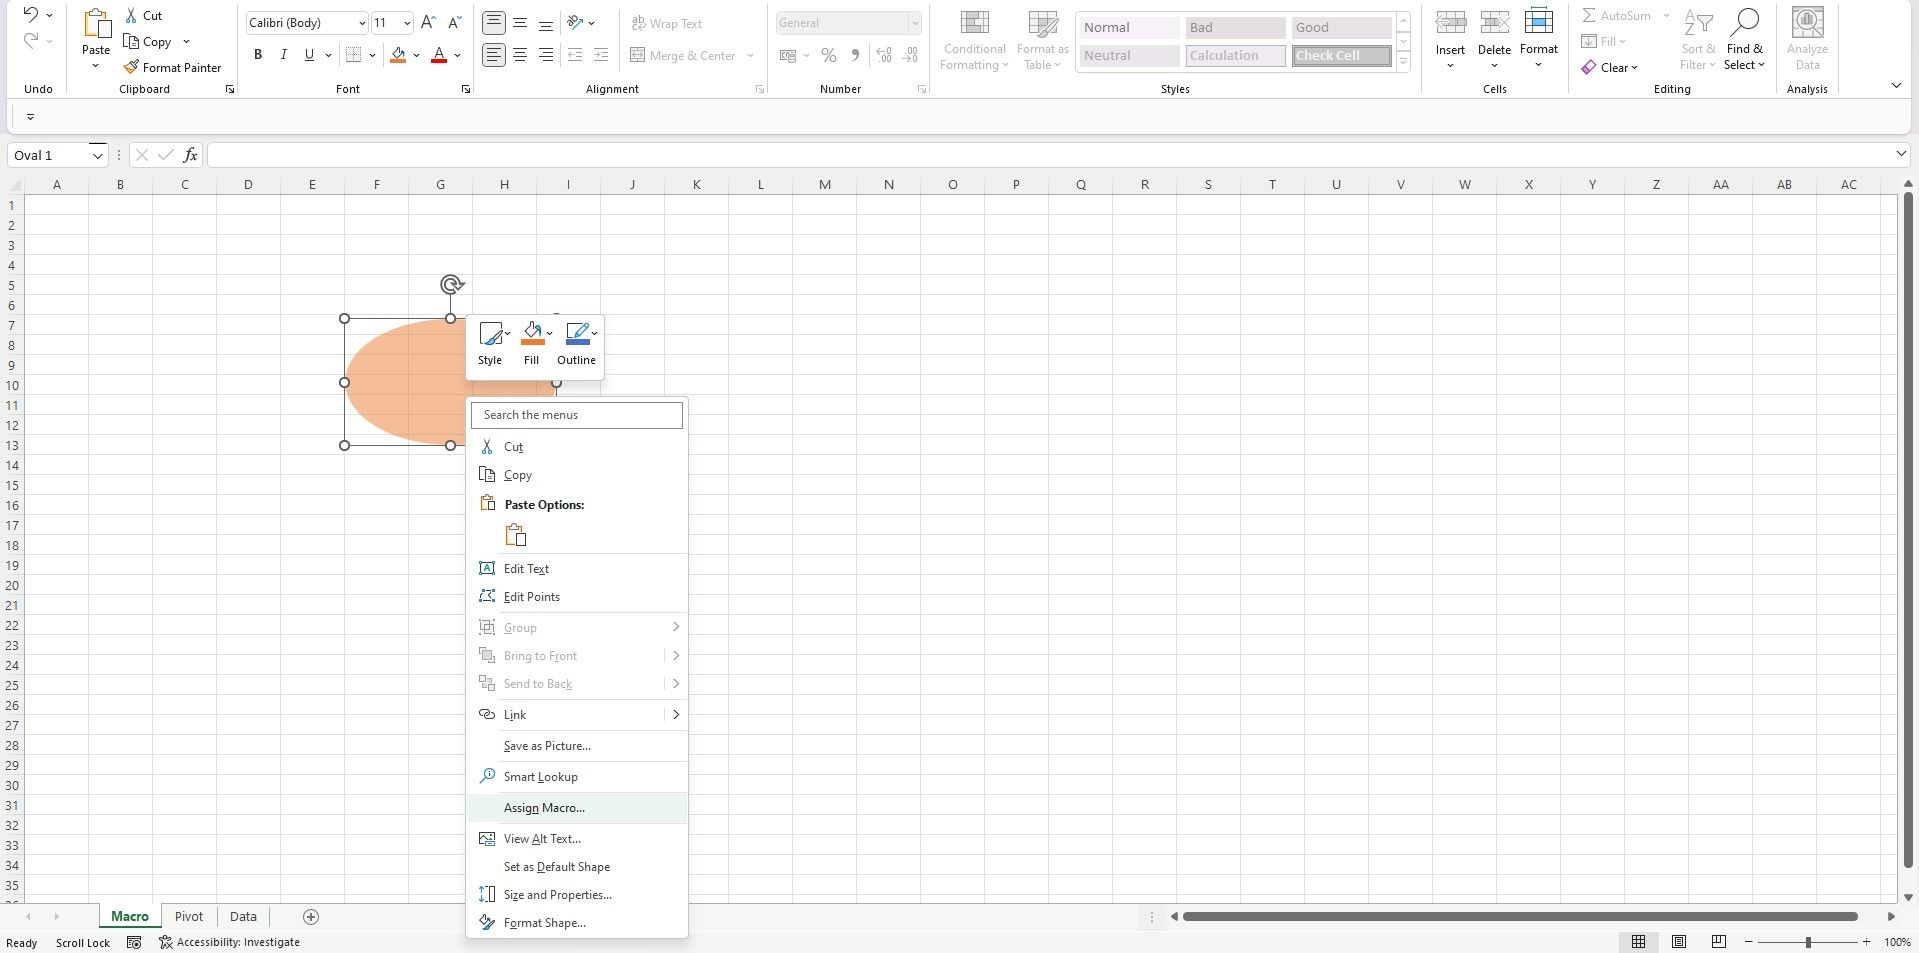
The Macro sheet contains the macro script, while the Data sheet contains your data. On the macro sheet, you can insert any shape of your choice and assign the macro to it. Right-click on the shape, and click on Assign Macro.
In the following dialog box, click on the name of your macro and click Ok. This step assigns the macro to the shape.
1. Open the Excel VBA Coding Editor
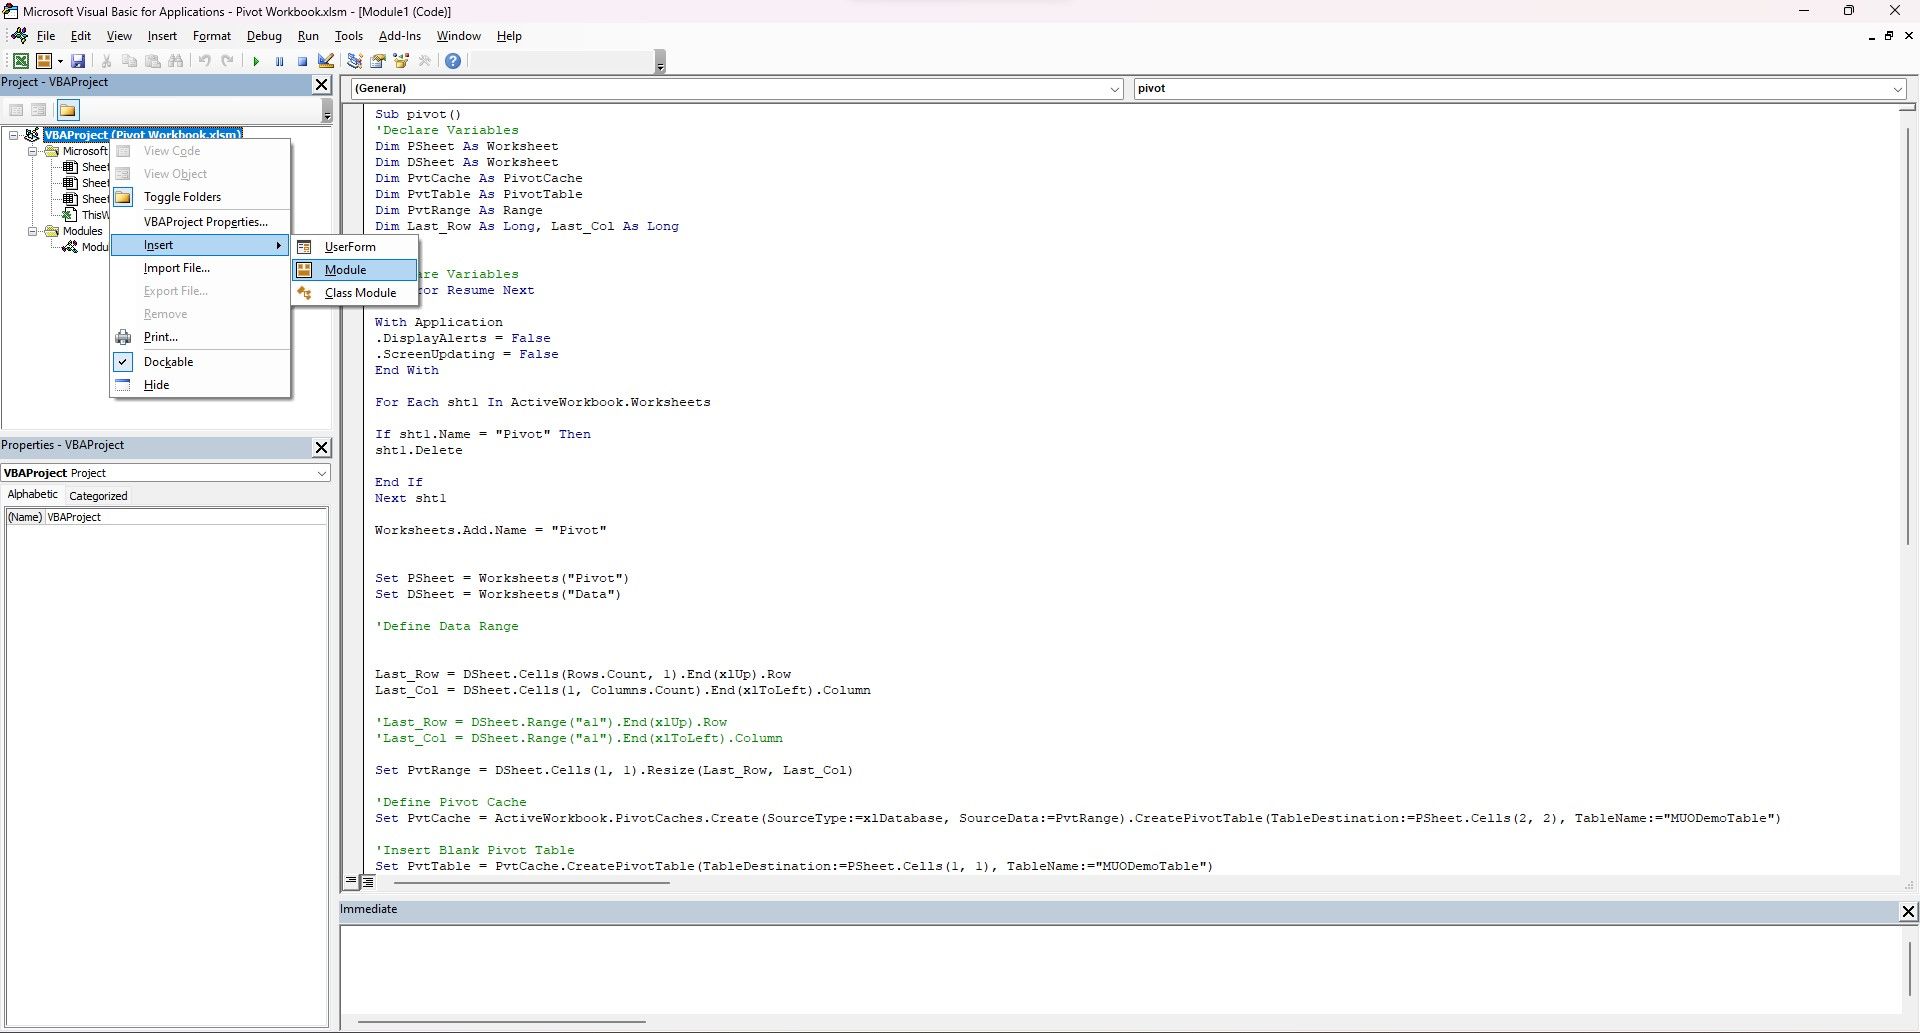
Press Alt + F11 to open the code editor. Once you're in the code editor, right-click the file name, followed by Insert and Module. It's important to remember that you will write all VBA code within a module before executing it.
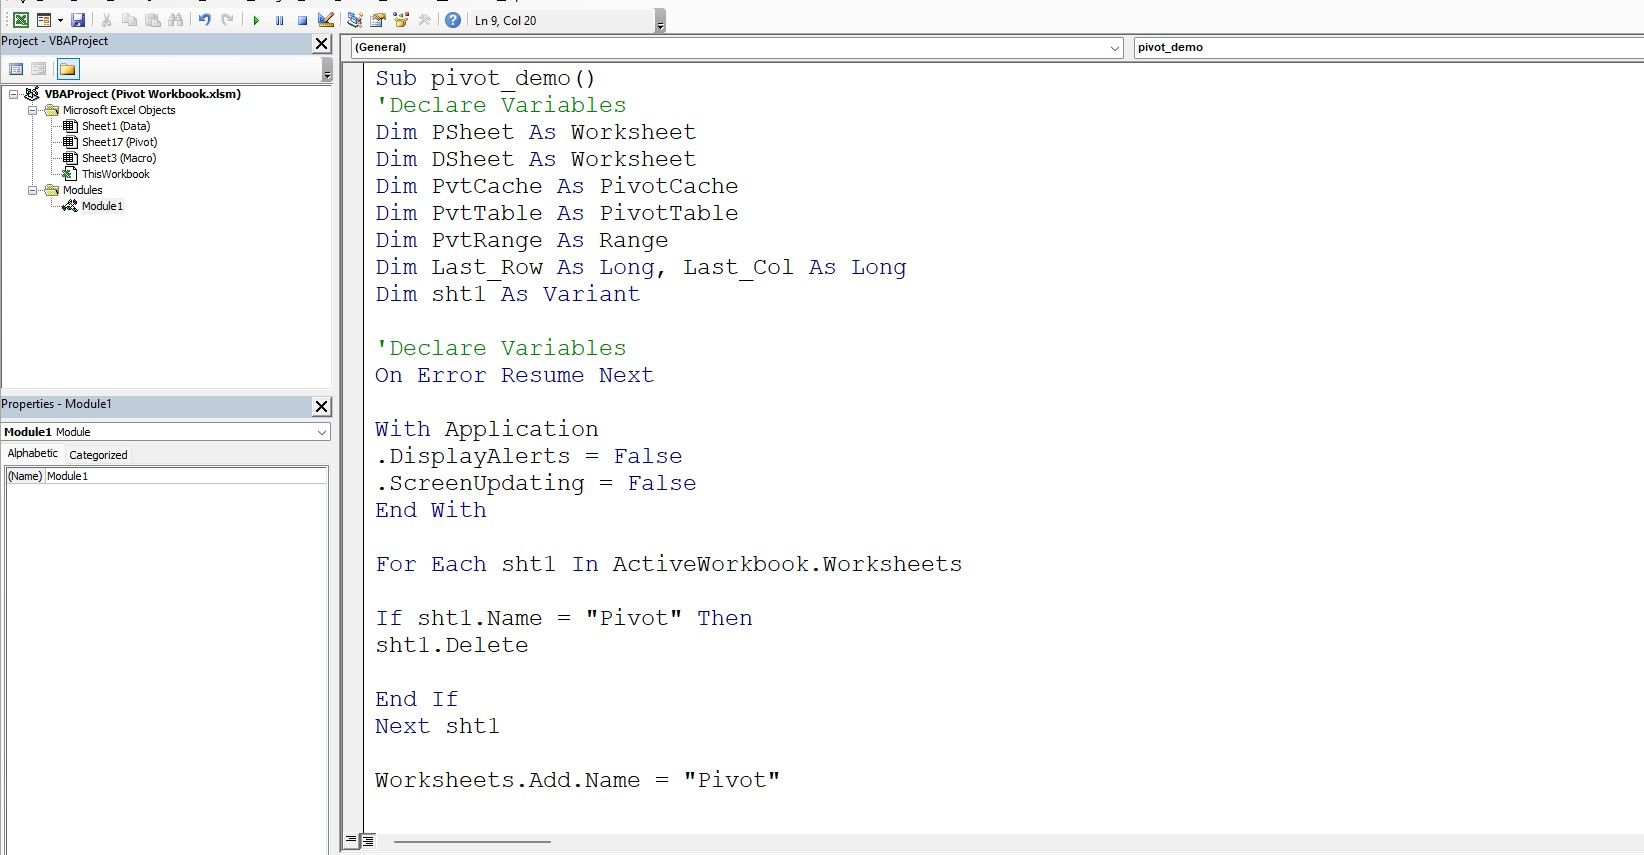
It's a good practice to use a module name that resonates with the purpose of the code. Since this is a demo, you can define the module name as follows:
sub pivot_demo()
The module name ends with End Sub, which is the ending command of a module:
End Sub
2. Declare Variables
Within the module, start by declaring variables to store some user-defined values you'll use in the script. You can use the Dim statement to declare variables, as follows:
        Dim PSheet As Worksheet, DSheet As Worksheet
Dim PvtCache As PivotCache
Dim PvtTable As PivotTable
Dim PvtRange As Range
Dim Last_Row As Long, Last_Col As Long
Dim sht1 as Variant
You'll use these variables for the following:
- PSheet: The destination sheet, where VBA will create a pivot.
- DSheet: The data sheet.
- PvtCache: A pivot cache holds the pivot.
- PvtTable: The pivot table object.
- PvtRange: A data range for the pivot.
- Last_Row and Last_Col: Last populated row and column within the data sheet (DSheet).
- Sht1: This variable is a variant.
3. Suppress Warnings and Messages
Unnecessary errors, warnings, and messages slow down your VBA codes. By suppressing such messages, you can speed up the process considerably.
Use the following code:
        On Error Resume Next

With Application
    .DisplayAlerts = False
    .ScreenUpdating = False
End With
Where:
- On Error Resume Next: This clause suppresses any run-time errors.
- Application: Application refers to MS Excel.
- DisplayAlerts: The DisplayAlerts property defines whether to show alerts.
- ScreenUpdating: This property defines whether to update changes in real time or only once the code has finished running.
When this code runs, it suppresses any alerts, warnings, and messages Excel would show otherwise. You can turn off DisplayAlerts and ScreenUpdating parameters by setting their values to False.
Towards the end of the code, you can turn them on again by setting the value as True.
4. Delete Any Existing Pivot Sheets
To create a new pivot table, you have two options. Firstly, delete the existing pivot sheet and use VBA to create a new sheet to store the pivot. Alternatively, you can use an existing worksheet to hold the pivot.
In this guide, let's create a new pivot sheet to store the pivot table.
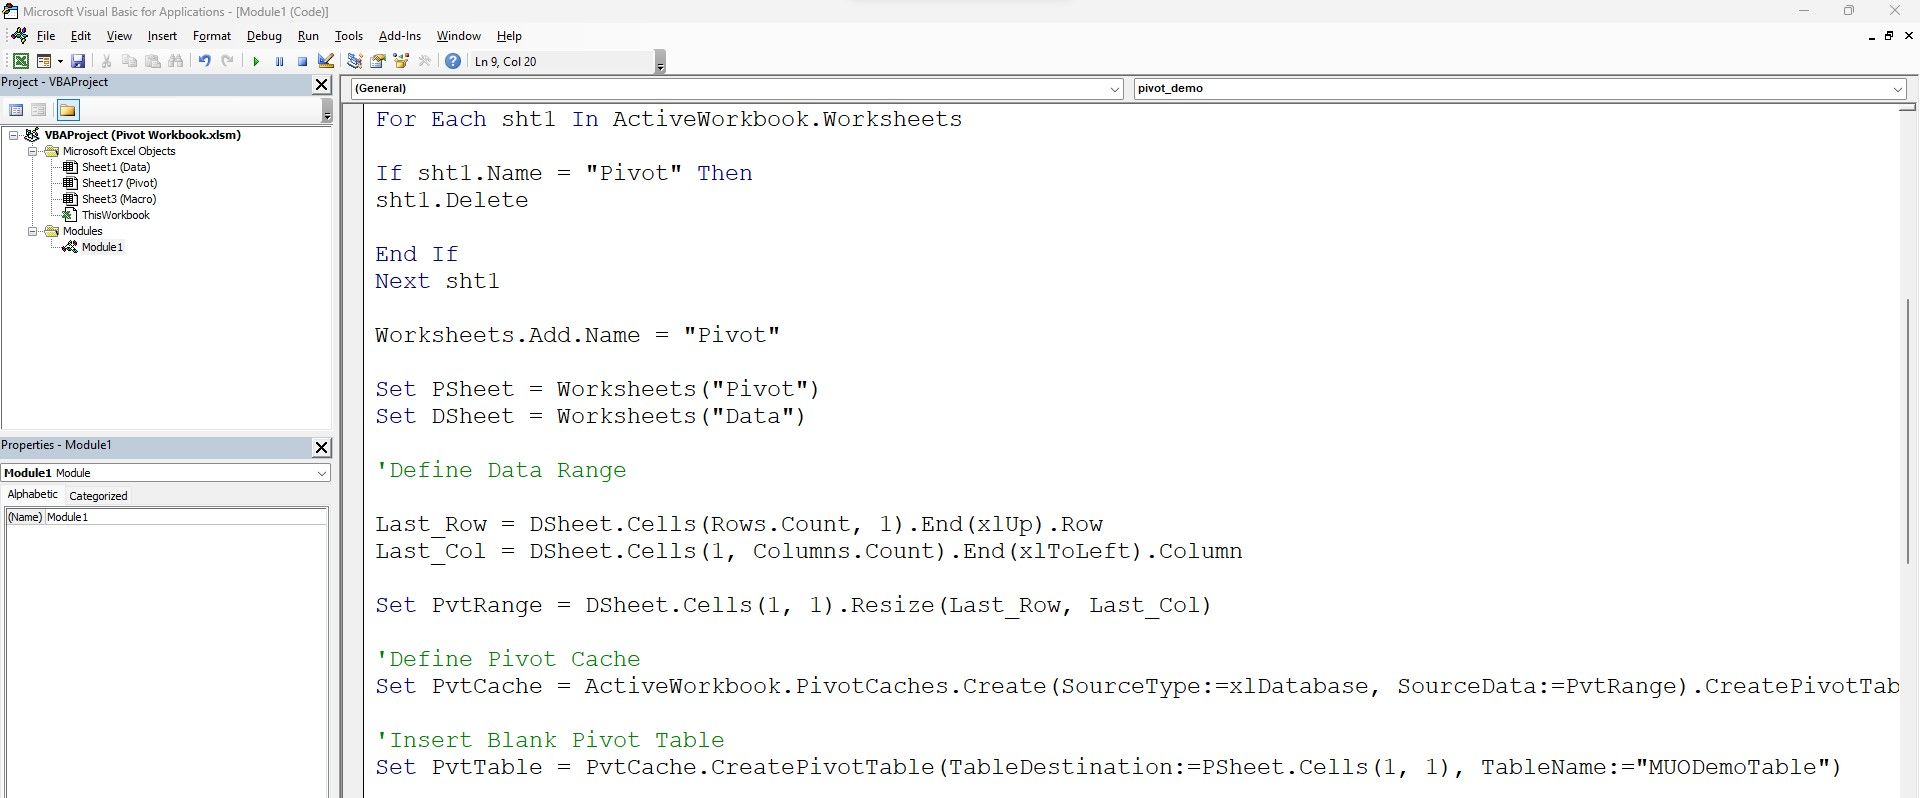
The for each loop cycles through each sheet within the workbook and stores the sheet name within the sht1 variable. You can use any variable name (sht1) to hold the sheet name. The loop cycles through every sheet within the current workbook, looking for one with the specific name (Pivot).
When the sheet name matches, it deletes the sheet and moves to the next sheet. Once the code checks all the sheets, it exits the loop and moves to the next part of the code, which adds a new sheet, Pivot.
Here's how you can do it:
        For Each sht1 In ActiveWorkbook.Worksheets
    If sht1.Name = "Pivot" Then
        sht1.Delete
    End If
Next sht1

Worksheets.Add.Name = "Pivot"
5. Define Data Source and Pivot Sheets
It's essential to create variables to store the references of the Pivot and Data sheets. These work as shortcuts, which you can reference throughout the rest of the code.
        Set PSheet = Worksheets("Pivot")
Set DSheet = Worksheets("Data")
6. Identify the Last Used Row and Column
This part of the code works dynamically, as it sizes up the last populated row and column within the data.
        Last_Row = DSheet.Cells(Rows.Count, 1).End(xlUp).Row
Last_Col = DSheet.Cells(1, Columns.Count).End(xlToLeft).Column
Set PvtRange = DSheet.Cells(1, 1).Resize(Last_Row, Last_Col)
Where:
- Last_Row: Variable to store the last populated row number, i.e. 9995
- Last_Col: Variable to store the last populated column number, i.e. 21
- PvtRange: PvtRange references the entire data range for the pivot
7. Create a Pivot Cache and a Pivot Table
A pivot cache holds the pivot table; therefore, you need to create a cache before creating a pivot table. You must use VBA's syntax references to make the pivot cache within the Pivot sheet.
By referencing the pivot cache, you need to create a pivot table. As a part of the pivot table, you can define the sheet, the cell reference, and the name of the pivot table.
        Set PvtCache = ActiveWorkbook.PivotCaches.Create(SourceType:=xlDatabase, SourceData:=PvtRange).CreatePivotTable(TableDestination:=PSheet.Cells(2, 2), TableName:="MUODemoTable")
Set PvtTable = PvtCache.CreatePivotTable(TableDestination:=PSheet.Cells(1, 1), TableName:="MUODemoTable")
Where:
- ActiveWorkbook: The current workbook where you have the Data and Pivot sheet.
- PivotCaches.Create: Default syntax to create a pivot cache.
- SourceType: Since you have the data within the workbook, you can define it as xlDatabase. Some other options include xlConsolidation, xlExternal, or xlPivotTable.
- SourceData: You can reference the previous pivot range as the source data.
- CreatePivotTable: Default command to create the pivot table.
- TableDestination: You need to specify the sheet and cell references where you want to create the pivot.
- TableName: Specify a pivot table name.
- CreatePivotTable: Default command to create the pivot table within the pivot cache.
8. Insert Rows, Columns, Filters, and Values
Since the pivot table is ready, you need to start adding the parameters within the filters, rows, columns, and aggregation values. You can use the VBA pivotfields command to start declaring the details.
To Add Filter Values:
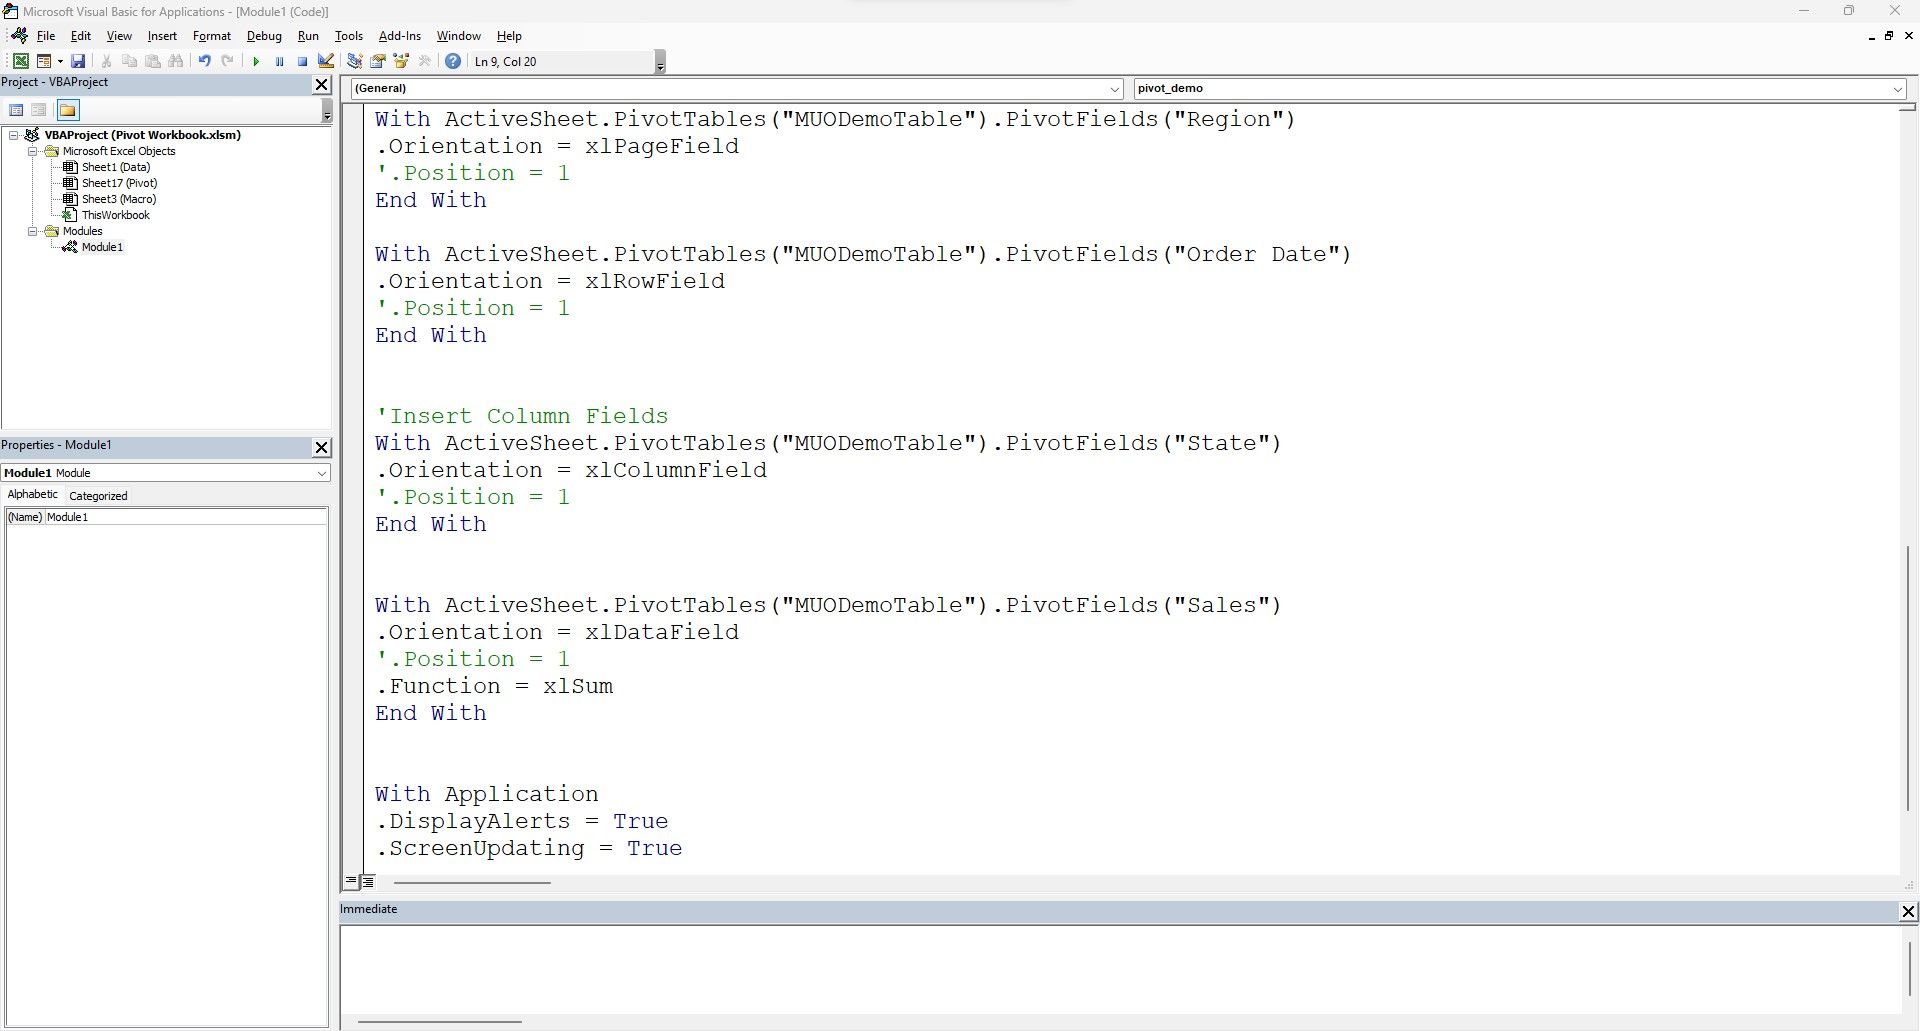
        With ActiveSheet.PivotTables("MUODemoTable").PivotFields("Region")
.Orientation = xlPageField
End With
To Add Row Values:
        With ActiveSheet.PivotTables("MUODemoTable").PivotFields("Sub-Category")
.Orientation = xlRowField
End With
To Add Column Values:
        With ActiveSheet.PivotTables("MUODemoTable").PivotFields("State")
.Orientation = xlColumnField
End With
To Add Aggregation Values:
        With ActiveSheet.PivotTables("MUODemoTable").PivotFields("Sales")
.Orientation = xlDataField
.Function = xlSum
End With
It's essential to note that you must reference the activesheet (Pivot sheet), followed by the pivot table name and the variable name. When you need to add the filter(s), row(s), and column(s), you can toggle between various syntax, which includes the following:
- xlPageField: To add filters.
- xlRowField: To add rows.
- xlRowField: To add columns.
Finally, you can use the xlDataField command to calculate the value aggregations. You can use other aggregate functions like xlSum, xlAverage, xlCount, xlMax, xlMin, and xlProduct.
9. Running the Excel VBA Code to Create Automatic Pivots
Finally, when the entire program is ready, you can run it by pressing F5 or clicking the play button. When you go back to the Pivot sheet in your workbook, you will see that a new pivot table is ready for you to review.
If you want to see a step-by-step execution of how the code command plays out line by line, you can navigate to the code editor and press F8 several times. This way, you can see how each line of code works and how VBA creates your pivots automatically.
Learning to Code Pivot Tables Automatically
Pivots are not restricted to MS Excel only. Programming languages like Python let you create optimized pivots with just a few lines of code.
Data optimization can't be easier than this. You can effectively pick and choose your commands in Python and accomplish a similar Excel-like pivot structure with ease.


