No matter the type of trader you are or the method of analysis you prefer, you need to understand price action to relate to different market happenings. Moreover, there is almost no way to use your technical indicators correctly without being able to interpret price information. What, then, is price action, and how does it work?
What Is Price Action?
Price action is the price movement of a financial asset. It forms the basis of all technical analysis, as technical analysts use past and present price information to make trading decisions.
Price action traders do not rely on technical indicators when trading. Rather, they study price movements to get enough information to make trading decisions. The belief behind this system of trading is that the market price is never wrong. Instead, it shows all that is happening in the market at any time.
3 Popular Price Action Trading Charts
The three most popular charts for interpreting price activities are the candlestick chart, the bar chart, and the line chart.
These charts are like statements you read to find out what is happening in the market at any given time. When you travel to a country, one of the things you want to understand is the language(s) spoken there, as that is the only way you can understand what they say and relate to whatever they are doing. You can see the charting types as the languages of a financial charting system. Understanding the information they give will tell you much about the market, thus forming the basis for price action.
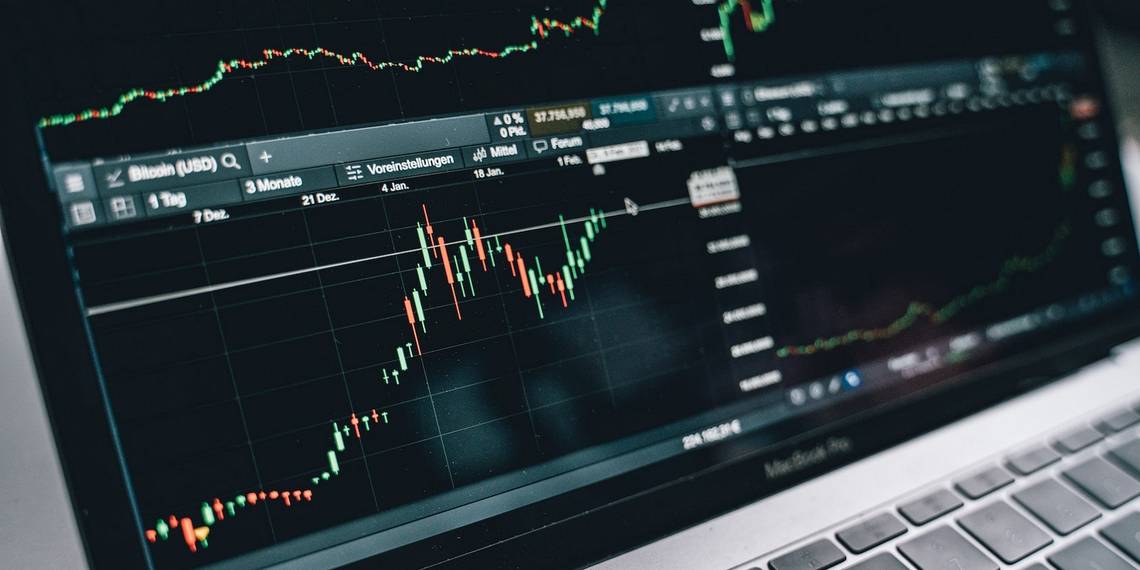
1. The Candlestick Chart
Candlestick charts are formed from candlestick-like shapes. The charting system originated in Japan several years ago, which is why the candlesticks are also called Japanese Candlesticks. The formations are the most popular for expressing price information on a crypto exchange.
Different candlestick patterns are formed as the price moves up and down. Although the formations look random, they are usually sufficient to give cryptocurrency traders the information needed to understand what is happening in the market.
Candlesticks show the market's open, close, high, and low prices for a particular trading session. The candlestick's body represents the price range between the open and close of a trading period. The default setting is usually a black or red candlestick, showing that the price closed lower than where it started (a bearish candlestick), and a blank, white, or green candlestick, showing that the price closed higher than where it started (a bullish candlestick).
A candlestick shows a crypto asset's highest, lowest, opening, and closing prices for a specified period. The opening price is the price at which a candlestick appears when the trading session begins. The closing price is usually the last price traded before another candlestick appears. While the high and low represent the highest and lowest prices traded during the trading session. Various shapes are formed by how long or short the candlesticks' bodies and wicks are, forming patterns that are interpreted differently.
2. The Bar Chart
Just like the name suggests, this charting type is reflected with bars. The bar chart is a collection of price bars, each showing price movements and activities within a certain period. A bar also displays the highest and lowest price levels reached and the opening and closing price(s) for the specified period.

The opening price is indicated by a horizontal foot on the left side of the bar, while the closing price is indicated by the horizontal foot on the right side. The top of the vertical bar shows the highest price traded, while the lowest price is at the bottom of the vertical bar.
3. The Line Chart
A line chart connects a series of price data with lines. It also shows market changes over time by drawing a line from one closing price to another. Line charts help cut off market noise and help to identify key support and resistance areas, making them easily recognizable.

The main drawback of line charts is that they may not provide enough information for day-to-day market trading compared to the two other chart types.
Do Price Action Traders Use Technical Indicators?
Now that we know and understand price action, the big question is whether you can use it alongside technical indicators.
Naked Price Chart
Some price action traders believe it is a waste of time to use any technical indicators in their analyses since the price gives them every piece of information they need. Naked price action traders, for example, might prefer to place their stop losses below the support provided by the chart and take profits below a major resistance provided by the chart rather than using any indicator to determine where they should be placed.
Apart from seeing technical indicators as unnecessary, they also believe that indicators respond to price and that the information they provide only results from what price does. For this reason, indicators won't always provide the best market data. They respond to the price late and would rather confuse price action traders by complicating decision-making.
Technical Indicators for Trade Support and Confluence
On the other hand, some price action traders use technical indicators to serve as confluences for their strategies. For example, some use the moving average, especially the exponential moving average, since it responds faster to recent price movements than the simple moving average, to get confluences for price support. The confluences serve as additional confirmations for trade entry and exit.
Another indicator that many price action traders find useful is the average true range. It is a volatility indicator that shows how much an asset moves on average over a given period, usually daily. The indicator helps them predict how much price moves in a given asset and period, which they can use to determine where to place stop losses and take profits.
Price action traders who use technical indicators only include them as a form of support or confluence but do not rely on them as the basis for their strategies.
The Need for Technical Tools
Although price action trading involves reading price charts, it also uses technical tools in its analysis. Traders use these tools to analyze and draw out patterns. Some of the tools used include the following:
- Trend Line Tools: Trend line, horizontal line, horizontal ray, arrow, information line, etc.
- Gann and Fibonacci tools: Fibonacci retracement, Fibonacci extension, Gann box, pitchfork, etc.
- Geometric Shapes: Rectangles, circles, eclipses, triangles, etc.
- Prediction and Measurement Tools: Long position, short position, date range, price range, etc.
These tools help make price analyses simpler and better. For example, many traders use horizontal lines and rectangles to make support and resistance zones clearer. As in the picture below, the rectangles make the price support and resistance zones more obvious, helping traders know where to place their trade entry and exit positions.

The Fibonacci and Gann tools make some hidden price supports and resistances visible.
There Are Many Ways to Interpret Price Action
Interpretations given to different price action patterns are subjective. Although candlestick patterns show what is happening in the market and are accessible to all traders in the same way, how they are interpreted is based on what each trader is looking for, his strategy, and his trading experience.
Based on strategies, a price pattern formation that a trader interprets as an entry signal could be an exit signal for another trader. Also, a trader with years of experience in price action trading is more likely to interpret the price chart better than a beginner who understands what the market is saying.
Lastly, no trading style guarantees a constant profit. As such, always remember to trade with a proper trading plan and put risk management practices in place.