Many useful indicators can help you when crypto trading, and the Relative Strength Index is one of them.
You need a combination of several analytical tools and indicators to trade crypto successfully. One such indicator is the Relative Strength Index (RSI). The RSI is one of the most popular indicators used by day traders, and using it correctly will make it a valuable tool in your trading arsenal.
So, what is the Relative Strength Index, and how can you use it in your crypto trades?
What Is the RSI?
The RSI is a momentum indicator used in technical analysis. This indicator examines the magnitude of recent price fluctuations to determine whether or not the price of a cryptocurrency is overbought or oversold.
The momentum oscillator, a line graph oscillating between two extremes, reads anywhere from 0 to 100. J. Welles Wilder invented it in his groundbreaking book New Concepts in Technical Trading Systems, published in 1978.
How the RSI Works
The RSI analyzes whether a crypto's price is overbought or oversold by measuring the size of recent price moves, using a formula to calculate overbought and oversold positions.
RSI Formula
The RSI is calculated using the following formula: RSI = 100 – (100 / [1 + RSI]), where RSI equals the average gains of up periods during the specified period divided by the average losses of down periods during the specified period.
You do not have to worry about calculating the RSI value of any crypto yourself; the indicator on exchange platforms does all the calculations for you. All you need to do is to input the needed data.
Overbought and Oversold Positions
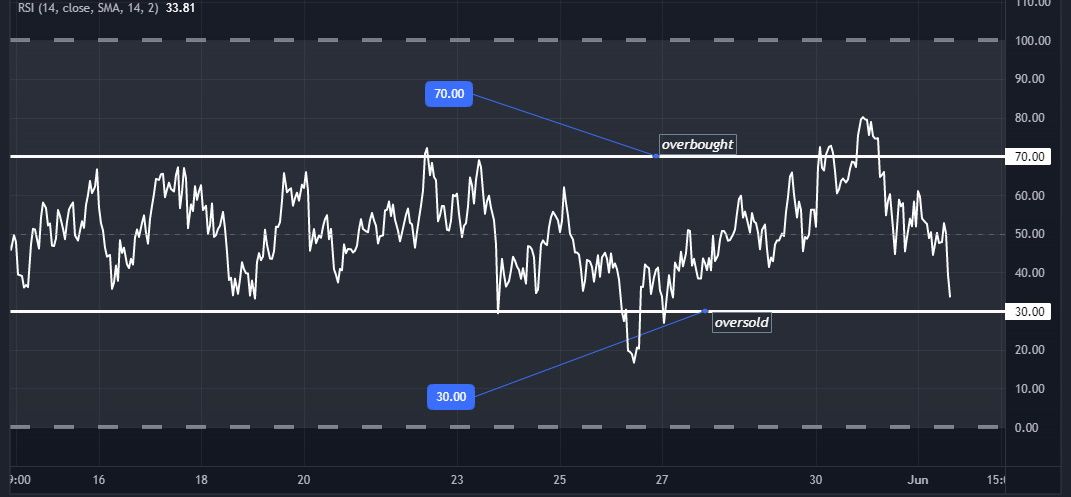
A crypto asset is said to be overbought when the RSI is above 70. At this point, the bullish trend is due for a correction. On the other hand, when it is below 30, the price is considered to be oversold, due for a rebound.
In a strong uptrend, the Relative Strength Index will frequently reach 70 or even higher for extended periods, whereas, in a downtrend, it may remain at 30 or below for an extended length of time. Traders can use the RSI to determine when to buy at oversold levels in a bullish trend. However, in a bearish trend, they look for selling opportunities when the price becomes overbought.
RSI level of above 50 indicates more buying momentum and shows stronger buying power in the market. On the other hand, a reading below 50 indicates more bearish power. You can always analyze the price activity around the 50-level to know when a bullish or bearish trend is about to change.
RSI Divergence
A price divergence on the Relative Strength Index occurs when a crypto price reaches a new high or falls to a new low, but the RSI does not form a corresponding new high or low value.
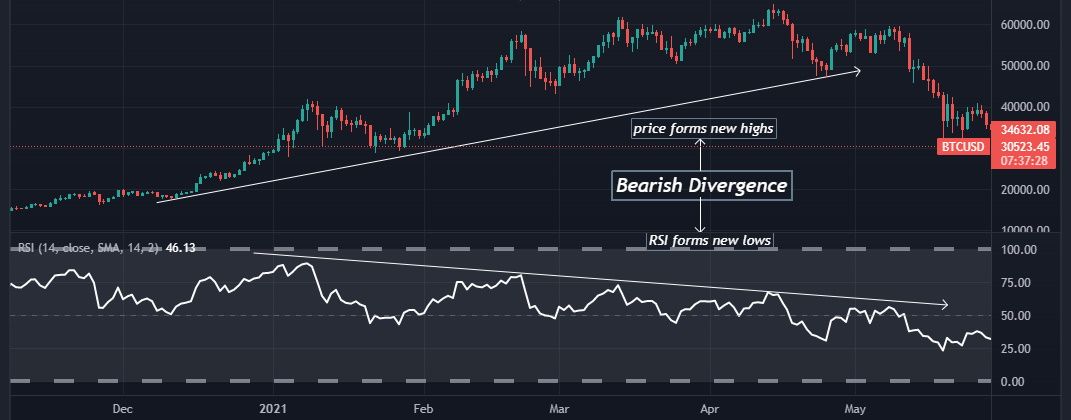
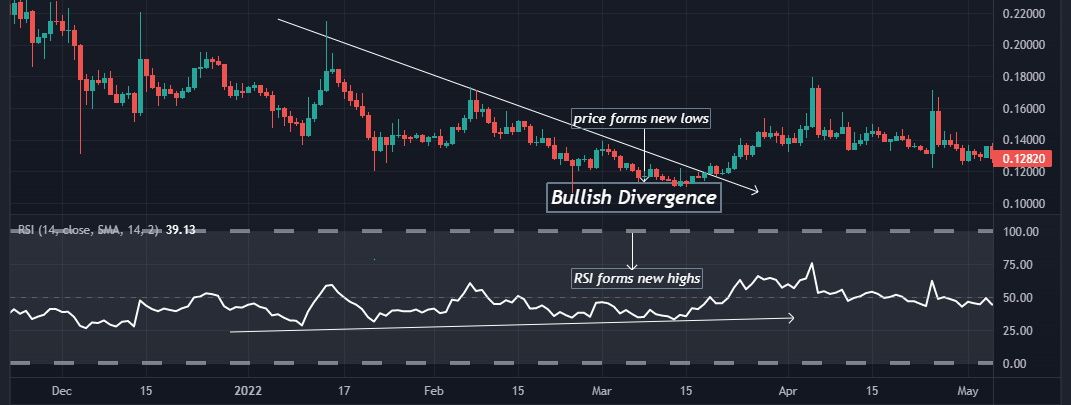
The RSI divergence is in two forms, the bearish and the bullish divergence. A bearish divergence forms when the price of a coin makes a new high while the RSI makes a new low. In this case, the RSI does not confirm the new high, indicating that price momentum has decreased. A bullish divergence occurs when the price makes a new low, but the RSI value does not. This phenomenon is taken as a buy signal.
In the chart above, the price kept moving upward, and at the same time, the corresponding RSI value was moving in the opposite direction. In other words, the price kept showing a bullish trend while the RSI showed a bearish trend. Traders usually interpret this signal as a weakening of the ongoing bullish momentum, which can cause a change in trend.
The bullish divergence occurs just as in the chart below: the price kept falling, but the RSI started to reduce the selling momentum (indicated by the rising RSI level). Traders, at such a point, start to anticipate a bullish reversal.
When using the RSI, traders look for the following:
- Buying opportunities at oversold positions (when the RSI value is 30 and below)
- Buying opportunities in a bullish trend (when the RSi is above 50 but below 70)
- Buying opportunities during a bullish reversal (in a bullish divergence)
- Selling opportunities at overbought positions (when the RSI value is 70 and above)
- Selling opportunities in a bearish trend (when the RSI value is below 50 but above 30)
- Selling opportunities during a bearish reversal (in a bearish divergence)
Limitations of the RSI
Despite its value to crypto traders, the RSI has its limitations.
The RSI Is Not Good Enough for Confirming Trade Entries
The Relative Strength Index is best applied as a preliminary indicator that notifies traders of trading opportunities that should be subjected to further analysis. It is not a good idea to use it as a stand-alone indicator, as doing so will result in unfavorable trading results. When utilized on its own, the RSI identifies overbought and oversold conditions.
However, it does not indicate whether such a condition is good for trade execution.
The RSI Can Be Misleading When a Trend Is Strong
Even though it has been established that the RSI can be used to predict price reversals, the RSI can't determine when such reversals will occur. As a result, it may continue to be overbought or oversold for longer than you have originally anticipated. This may continue for several days in higher timeframes, especially those using long-term crypto trading strategies.
Use the RSI With Other Technical Indicators
Even though the Relative Strength Index (RSI) might alleviate some of the stress associated with decision-making, you should never rely solely on it. Keep in mind that there is no guarantee that the RSI will work in every situation. Therefore, including more indicators to confirm your trading decisions is good.
Successful traders who use the RSI combine it with indicators like the Moving Average Convergence Divergence (MACD), Simple and Exponential Moving Averages, and many other technical indicators to confirm RSI signals.
The Relative Strength Index (RSI) is a powerful tool for day traders. But, of course, you shouldn't put too much faith in it because the outcome is never certain. A prediction made by the RSI is nothing more than an interpretation of the data from the past and has very little to do with the present or the future.


