
Microsoft Excel is an excellent data visualization and analysis software. It uses a spreadsheet system that allows you to organize, calculate, store, and manipulate your data with formulas.
In case you are working with large datasets, you can benefit from learning how to use Descriptive Statistics in Excel. Descriptive Statistics will summarize your dataset, providing a rundown of your data's key statistics. Here is a simple guide to get you started.
How to Add Data Analysis to Excel
Before you can use the Data Statistics tool, you need to install Excel's Data Analysis ToolPak. To do this, click on File > Properties > Add-Ins. At the bottom, where it says Manage, click on Go...

In the new window that pops up, make sure that you have the Analysis ToolPak checked. Once you do that, click on OK, and the tool will be under the Data tab in Excel.

How to Run Descriptive Statistics
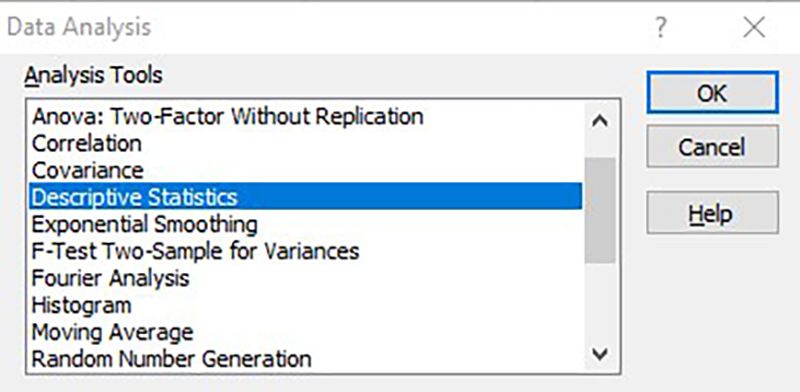
- To use Descriptive Statistics, you first need to go to Data > Data Analysis.
-
From the given options, click on Descriptive Statistics and then click OK.
- The Input Range is the most important. Here you need to select your data. You can do this by selecting the first row in Excel and then selecting the last row while holding Shift on your keyboard.

Here are all the options explained:
|
Input Range |
Select the variables that you want to analyze. You can add multiple variables, but they need to form a contiguous block. |
|
Grouped By |
Choose how you want to organize the variables. |
|
Labels in first row |
If you have labels in the first row, you should check this option. |
|
Output Range |
Select the range in your spreadsheet where you want to see the results. |
|
New Worksheet Ply |
The results will appear in a new worksheet. |
|
New Workbook |
The results will appear in a new workbook. |
|
Summary statistics |
This option will display most of the descriptive statistics. |
|
Confidence Level for Mean |
This option will display the confidence interval for mean. |
|
Kth Largest |
This option will display the highest value by default. If you enter number two, it will display the second-highest value, number three will display the third-highest value, and so on. |
|
Kth Smallest |
This option will display the lowest value by default. If you enter number two, it will display the second-lowest value, number three will display the third-lowest value, and so on. |
How to Read the Results
|
Mean |
The average value of your data. You could also use the =AVERAGE(data) function. |
|
Standard Error |
This is a statistical term that uses standard deviation in order to measure the accuracy with which the sample distribution represents a population. The higher the Standard Error, the higher the variability. You can also use the =STDEV.S(data)/SQRT(COUNT(data)) function. |
|
Median |
Shows the middle number in a sorted list. |
|
Mode |
Shows the value that appears the most in your data. You can also use the =MODE.SNGL(data) function. |
|
Standard Deviation |
Will measure the standard deviation for your data set. You can also use the =STDEV.S(data) function. |
|
Sample Variance |
Shows the square of Standard Deviation. You can also use =VAR.S(data) function. |
|
Kurtosis |
Shows how much the tails of a distribution are different from the tails of a normal distribution. By default, the normal distribution will have a Kurtosis value of zero. |
|
Skewness |
Measures the asymmetry of your data set, where zero indicates a perfectly symmetrical distribution. You could also use the =SKEW(data) function. |
|
Range |
Shows the difference between the largest and smallest values in your data. |
|
Minimum |
Shows the minimum value in your data set. You can also use the =MIN(data) function. |
|
Maximum |
Shows the maximum value in your data set. You can also use the =MAX(data) function. |
|
Sum |
Shows the total of all the values in your data set. You can also use the =SUM(data) function. |
|
Count |
Will count the number of values in your data. |
|
Largest(2) |
Shows the largest number in your data set depending on the number you chose for the Kth Largest option. |
|
Smallest(2) |
Shows the smallest number in your data set depending on the number you chose for the Kth Smallest option. |
|
Confidence Level(95.0%) |
Shows the confidence level at 95% for your data. |
Explore Advanced Data Analysis With the Analysis ToolPak
Excel's Analysis ToolPak allows you to do various more advanced analyses for your data. It gives you a tool to easily calculate a series of simple descriptive statistics for your dataset, including mean, minimum, maximum, standard deviation, and others.