Chrome DevTools is an essential asset for developers. While other browsers offer pretty handy troubleshooting tools, Chrome DevTools is worth your attention because of its multi-functional interface and popularity.
Chrome is the most popular browser for developers due to its powerful suite of debugging tools. Using Chrome DevTools is easy, but you need to understand how it works to get the most out of it.
How the Chrome Developer Tools Work
Chrome DevTools let you solve problems on a website via its error console and other debugging and monitoring tools. Using DevTools exposes frontend loopholes and lets you monitor how your website appears on mobile and tablet devices.
With DevTools, you can carry out real-time edits on a website's code, like JavaScript, HTML, and CSS, and get instant results of your changes.
The changes you make via the DevTools don't affect the website permanently. They only temporarily display the expected outcome as if you had applied them to the actual source code. This lets you work out ways to get your website to load much faster and makes it easier to iron out bugs.
How to Access Chrome DevTools
You can access Chrome DevTools in several ways. To open the developer tools with the shortcut method on Mac OS, press Cmd + Opt + I. If you're using the Windows OS, hit the Ctrl + Shift + I keys on your keyboard.
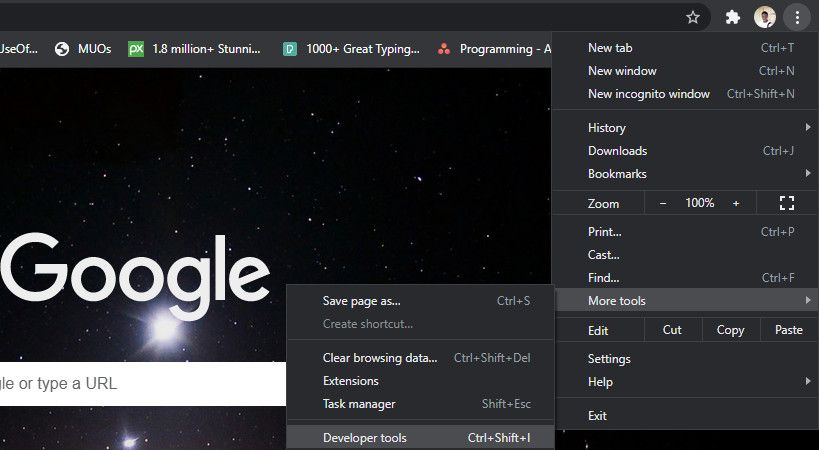
Alternatively, you can access the Chrome developer tools by clicking on the three dots at the top-right corner of the screen. Head to More tools and select Developer tools. Another option is to right-click on the web page and click on the Inspect option.
Using the Chrome Developer Tools for Website Diagnosis
Chrome DevTools offer several ways to tweak and troubleshoot a webpage. Let's take a look at some of the ways DevTools can help you.
See How Your Website Looks on a Smartphone
Once you switch your Chrome browser to developer mode, it renders a half-sized version of your webpage. However, this won't give you a real view of what it would look like on a smartphone or tablet.
Thankfully, in addition to setting the screen size of a webpage, Chrome DevTools lets you switch between different mobile screen types and versions as well.
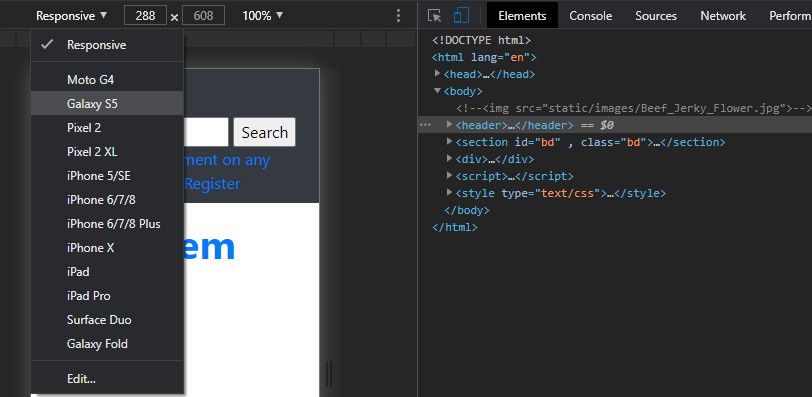
To access that option, toggle on the Inspect mode. Next, click on the Responsive drop-down at the top-left corner of the DevTools and select your preferred mobile device. The webpage then renders and adjusts to fit the size of the mobile device you selected.
Access the Source Files of a Webpage
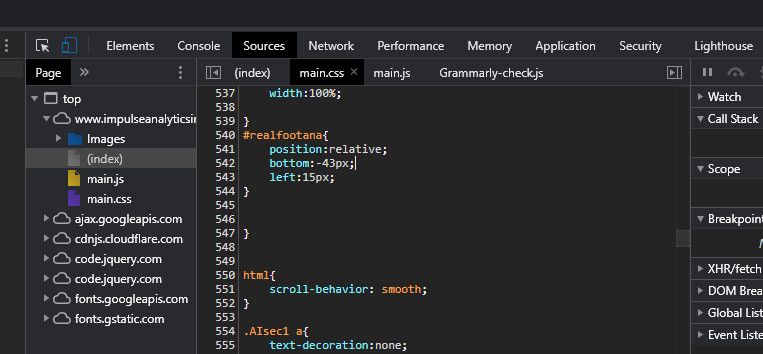
You can access the files that make up a webpage via Chrome DevTools. To access these files, click on the Sources option at the upper part of the DevTools menu. This exposes the file system of the website and also gives you editing.
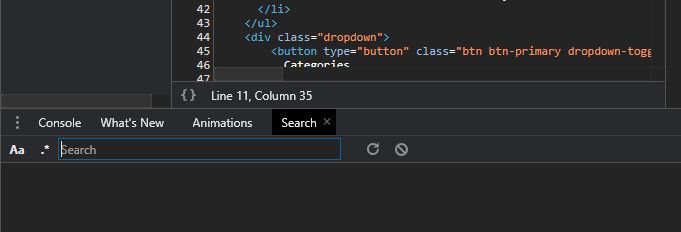
You can also search for source files, which can be helpful when you're dealing with a webpage that has many resources. To search for a source file via DevTools, click on the Search option just above the console.
However, if you can't find the Search option, a better alternative is to use keyboard shortcuts. On Mac OS, press the Cmd + Opt + F keys to search for a source file. If you're using Windows OS, press the Ctrl + Shift + F key to access the source file search bar.
Perform Live Edits to a Webpage
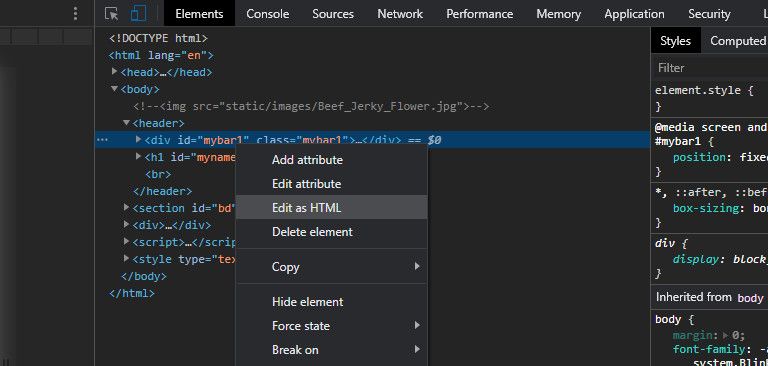
One of the main purposes of using the DevTools is to carry out an instant fake edit of the elements on a webpage. Once you switch to the developer tools, you can edit a website's HTML content by clicking on the Elements option. Then, right-click on any point you want to apply changes to within the code editor and select Edit as HTML.
To edit CSS properties that aren't inline, select Sources. Next, select the CSS file you want to edit. Place your cursor on your line of choice within the code console to perform a live edit. Doing this gives you instant feedback on any style changes you apply to the webpage.
Note that when you edit a page via the DevTools, reloading the page on your browser reverts it to its original form, and the edit is only visible to you. Editing via DevTools neither affects the smooth running nor usage of that website for other users.
Debug JavaScript Code with the DevTools Console
One of the best ways to debug JavaScript is using Chrome's developer tools. It gives you a direct report of invalid scripts as well as the exact location of the bug.
It's good practice to always keep DevTools open while designing a website with JavaScript. For instance, running the console.log() command of JavaScript on a set of instructions displays the result of that log in the DevTools console if the program runs successfully.
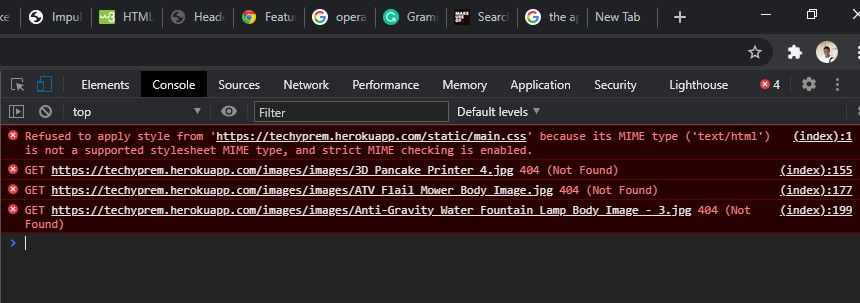
By default, the console reports any JavaScript issues on your website. You can find the console at the lower part of the DevTools or access it by clicking on the Console option at the top of the Chrome DevTools window.
Monitor Resource Loading from a Database
In addition to debugging JavaScript, the console can also give you a detail of resources that aren't loading correctly from the website's database.
While this is not always the best way to debug backend issues, it still tells you which resources are returning a 404 error after running a database query of those elements.
Switch the Orientation of Chrome Developer Tools
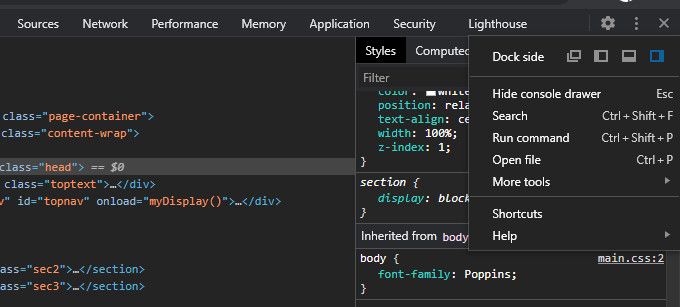
To change the position of the Chrome developer tools, click on the three menu dots within the DevTools (not the main one on the browser). Then select your preferred position from the Dock side option.
Install Chrome DevTools Extensions
You can also install language or framework-specific extensions that work with Chrome DevTools. Installing these extensions lets you debug your webpage more efficiently.
You can access a list of available extensions for Chrome DevTools in Chrome's Featured DevTools Extensions gallery.
Check for Security Issues on a Website
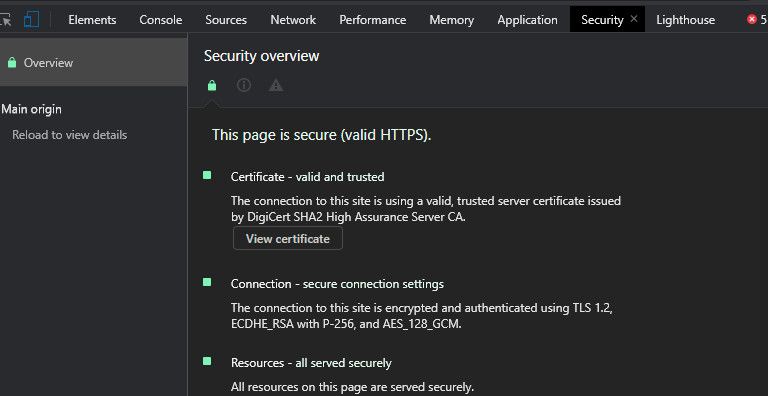
Chrome DevTools lets you assess how secure your website is, based on parameters like availability of web security certificates and how secure the connection is, among others. To check if your website is secure, click on the Security option at the top of the DevTools.
The Security tab gives you an overview of your website's security details and tells you any potential threats.
Audit Your Website
Chrome DevTools has a feature that lets you check the overall performance of your website based on specific parameters.
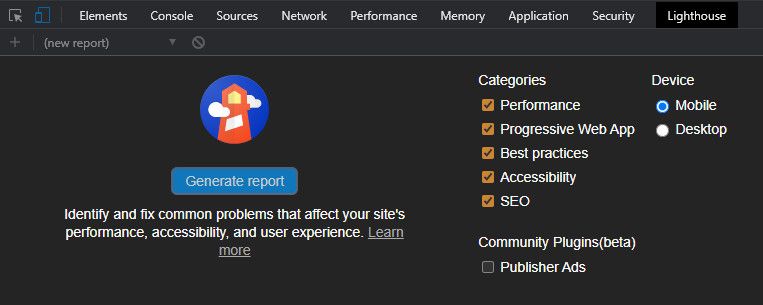
To access that feature, select the Lighthouse option at the top of the DevTools window. Next, select the parameters you want to check, then tick either the Mobile or Desktop options to see how your webpage performs on different platforms.
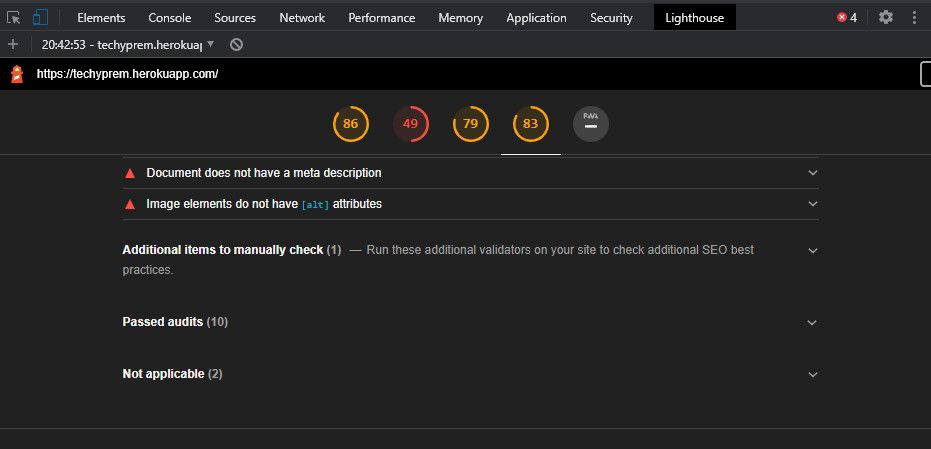
Next, click on Generate report to run an analysis of your webpage based on the parameters you selected earlier.
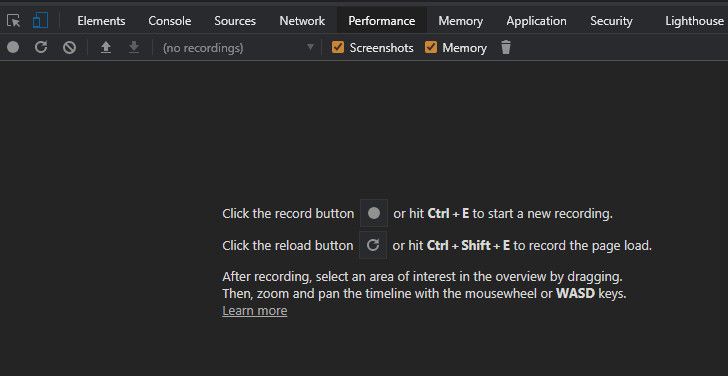
You can also assess the run-time or loading performance of a website by clicking on the Performance option. To run a test, click on the icon next to the Click the record button option to perform a run-time analysis. Alternatively, click on the reload button below it to assess the load-time performance. Click on Stop to stop the analyzer and display the results.
Take Advantage of Chrome DevTools
Depending on what you need it for, Chrome DevTools let you do more than just simple website debugging. Thankfully, DevTools are easy to use for programmers of all skill levels. You can even learn some basics of website frontend development by looking up the source code of websites you visit.
You might also discover some other options we didn't discuss in this article. So, feel free to play around with the available features. Besides, tweaking these features doesn't harm a website a bit.


