When it comes to anticipating market movements in crypto, we can feel a little overwhelmed at times. With the cryptocurrency landscape regularly exhibiting extremely volatile and erratic behavior driven by factors like sentiment, or unforeseen issues with protocols, it's easy to become lost when tracking performance. However, identifying primary, secondary, and tertiary trends is a great approach to spotting buying opportunities and anticipating future movements.
But what are primary, secondary, and tertiary trends in crypto? And how can they help investors to move smarter when navigating the market?
Applying Dow Theory to Crypto
Although cryptocurrencies are a new entity, we can still study them using a century-old approach to technical analysis. Dow Theory looks at the behavior of market trends and offers signals that can be used to spot emerging primary trends. Subsequently, this can be utilized to make data-driven investment decisions.
Dow Theory can be applied to cryptocurrency trading, much like stocks and shares. The theory anticipates that everything concerning a cryptocurrency is considered in its market price. For all the finer details of the stock and the wider market, investors can expect to see an asset's circumstances accounted for in its performance.
This makes it extremely useful to study how prices rise and fall across the world of crypto. With prices constantly rising and falling far more aggressively than traditional stocks, Dow Theory enables investors to predict market behavior with greater accuracy.
Understanding the Phases of Trends
For investors, it's essential to spot when a new trend is forming. For this, trends are generally broken into three phases, all of which can be identified when exploring price histories.
Firstly, we have the accumulation phase, which occurs when knowledgeable investors identify leading indicators and begin buying or selling a coin that they believe will begin to rise in value, despite the wider market remaining unaware of an upcoming price movement.
Once the rest of the market recognizes this accumulation, we enter the public participation phase, which occurs when larger volumes of traders begin following the actions of the early market movers. Again, because of the heavy sentiment-driven crypto markets, FOMO can come into play here and make trends significantly more pronounced than, say, on traditional stock markets.
Finally, the distribution phase occurs when early-acting investors believe that the trend has plateaued and subsequently redistribute their holdings into other coins on the market.
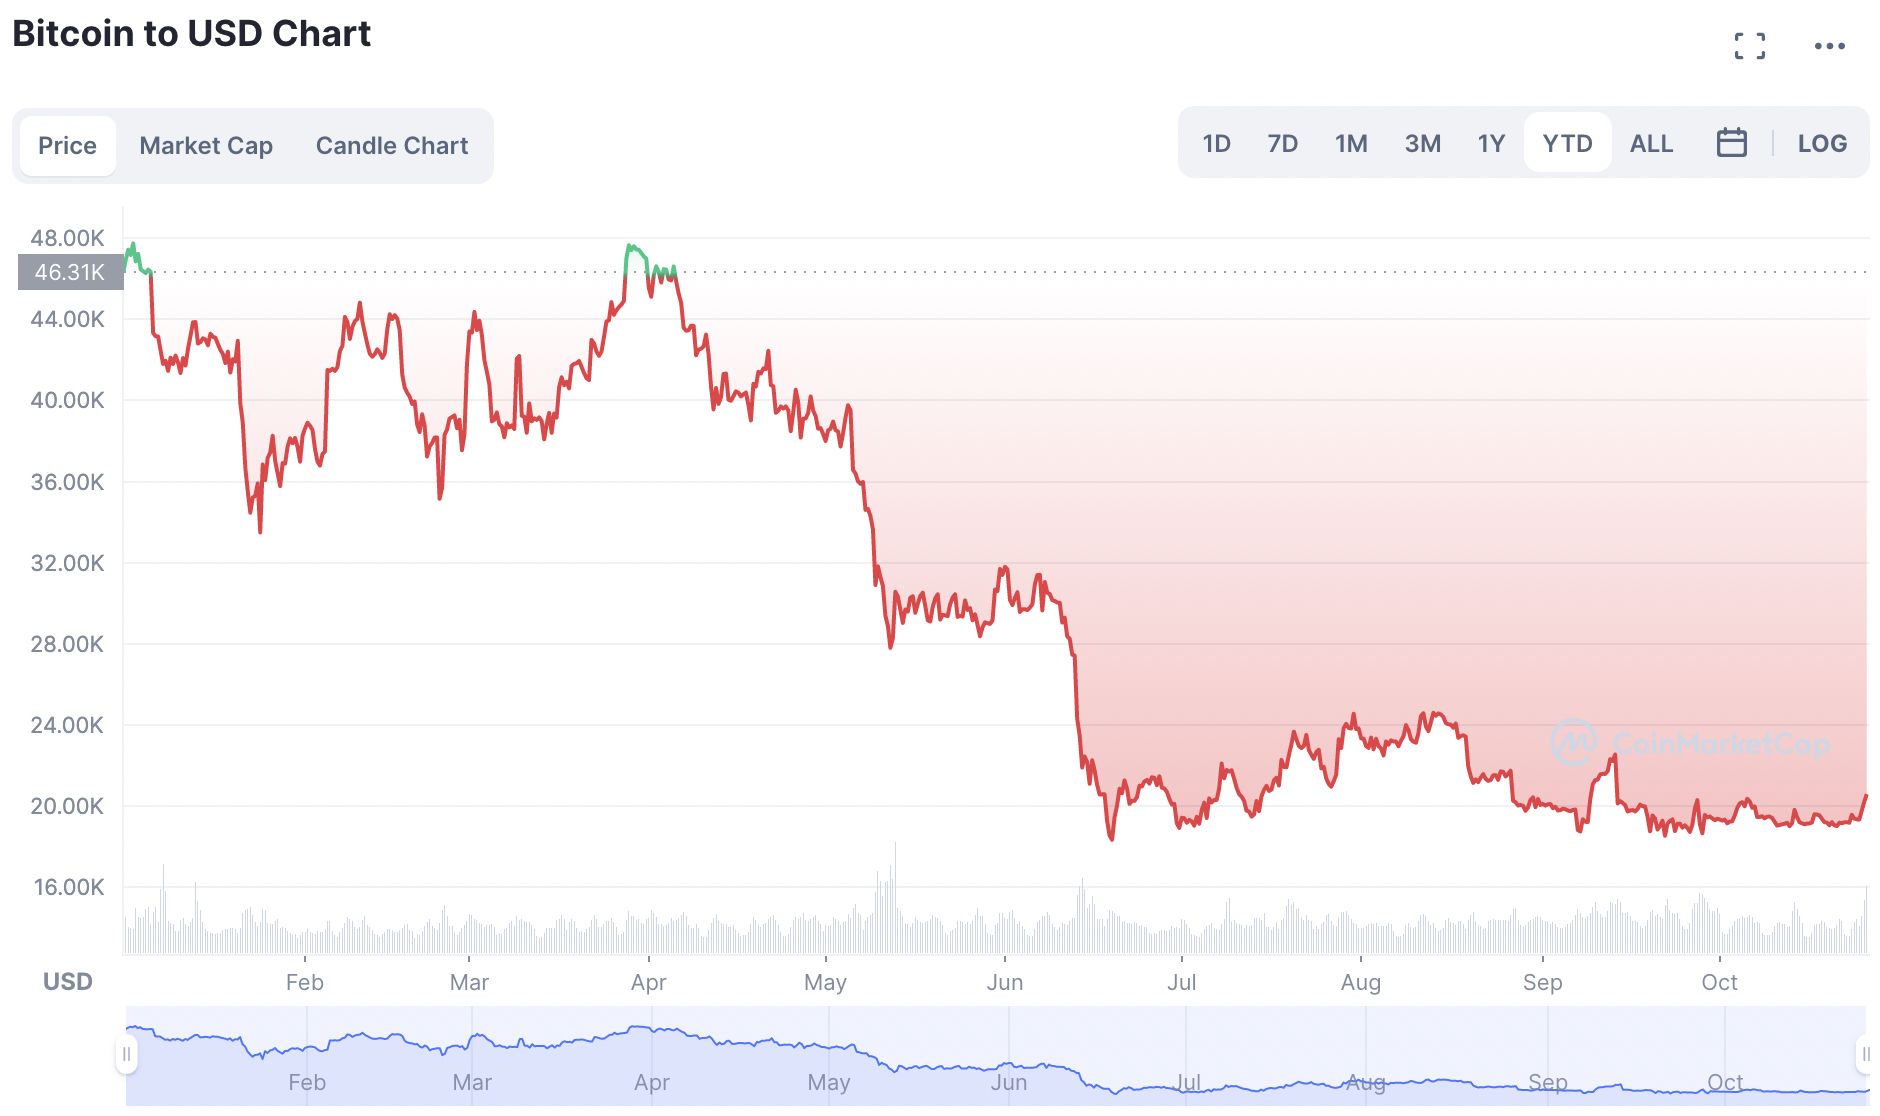
One of the key ways of spotting when a new phase is beginning is by looking at trading volumes recorded for currencies. For example, below, we can see in the gray bar chart at the bottom of Bitcoin's price history that higher trading volumes usually accompany trend reversals as users seek to buy and sell their holdings.
Now, let's take a deeper look at the trends and how they can influence price performance across the crypto market.
What Is a Primary Trend?
According to Dow Theory, three kinds of trends dictate price movements. Firstly, we have primary trends, representing significant market movements that can last several months or years.
In the world of crypto, we often hear of bull markets and bear markets; these are primary trends that can signify prices moving up or down over long periods.
Taking Bitcoin's price movements in the wake of its most recent halving event in May 2020, we can see that the coin has been influenced by several bull and bear markets, with a sustained downward trend visible from the asset's all-time high of $69,000, which was struck on November 10th, 2021.
Bitcoin's most recent primary trend signifies a sustained negative price movement, which has led to experts labeling 2022 as the beginning of crypto winter. However, they can also help traders to identify secondary trends, which can be lucrative short-term investments.
Identifying a Secondary Trend
Crucially, secondary trends will always act as a contrarian force that moves in the opposite direction to the primary trend. This makes identifying secondary trends highly useful for traders.
Typically, a secondary trend works on a shorter-term basis and can manifest itself as a dip within a longer bull cycle or vice versa. Because they're an opposing trend that works on a shorter time scale, identifying secondary trends can be difficult.
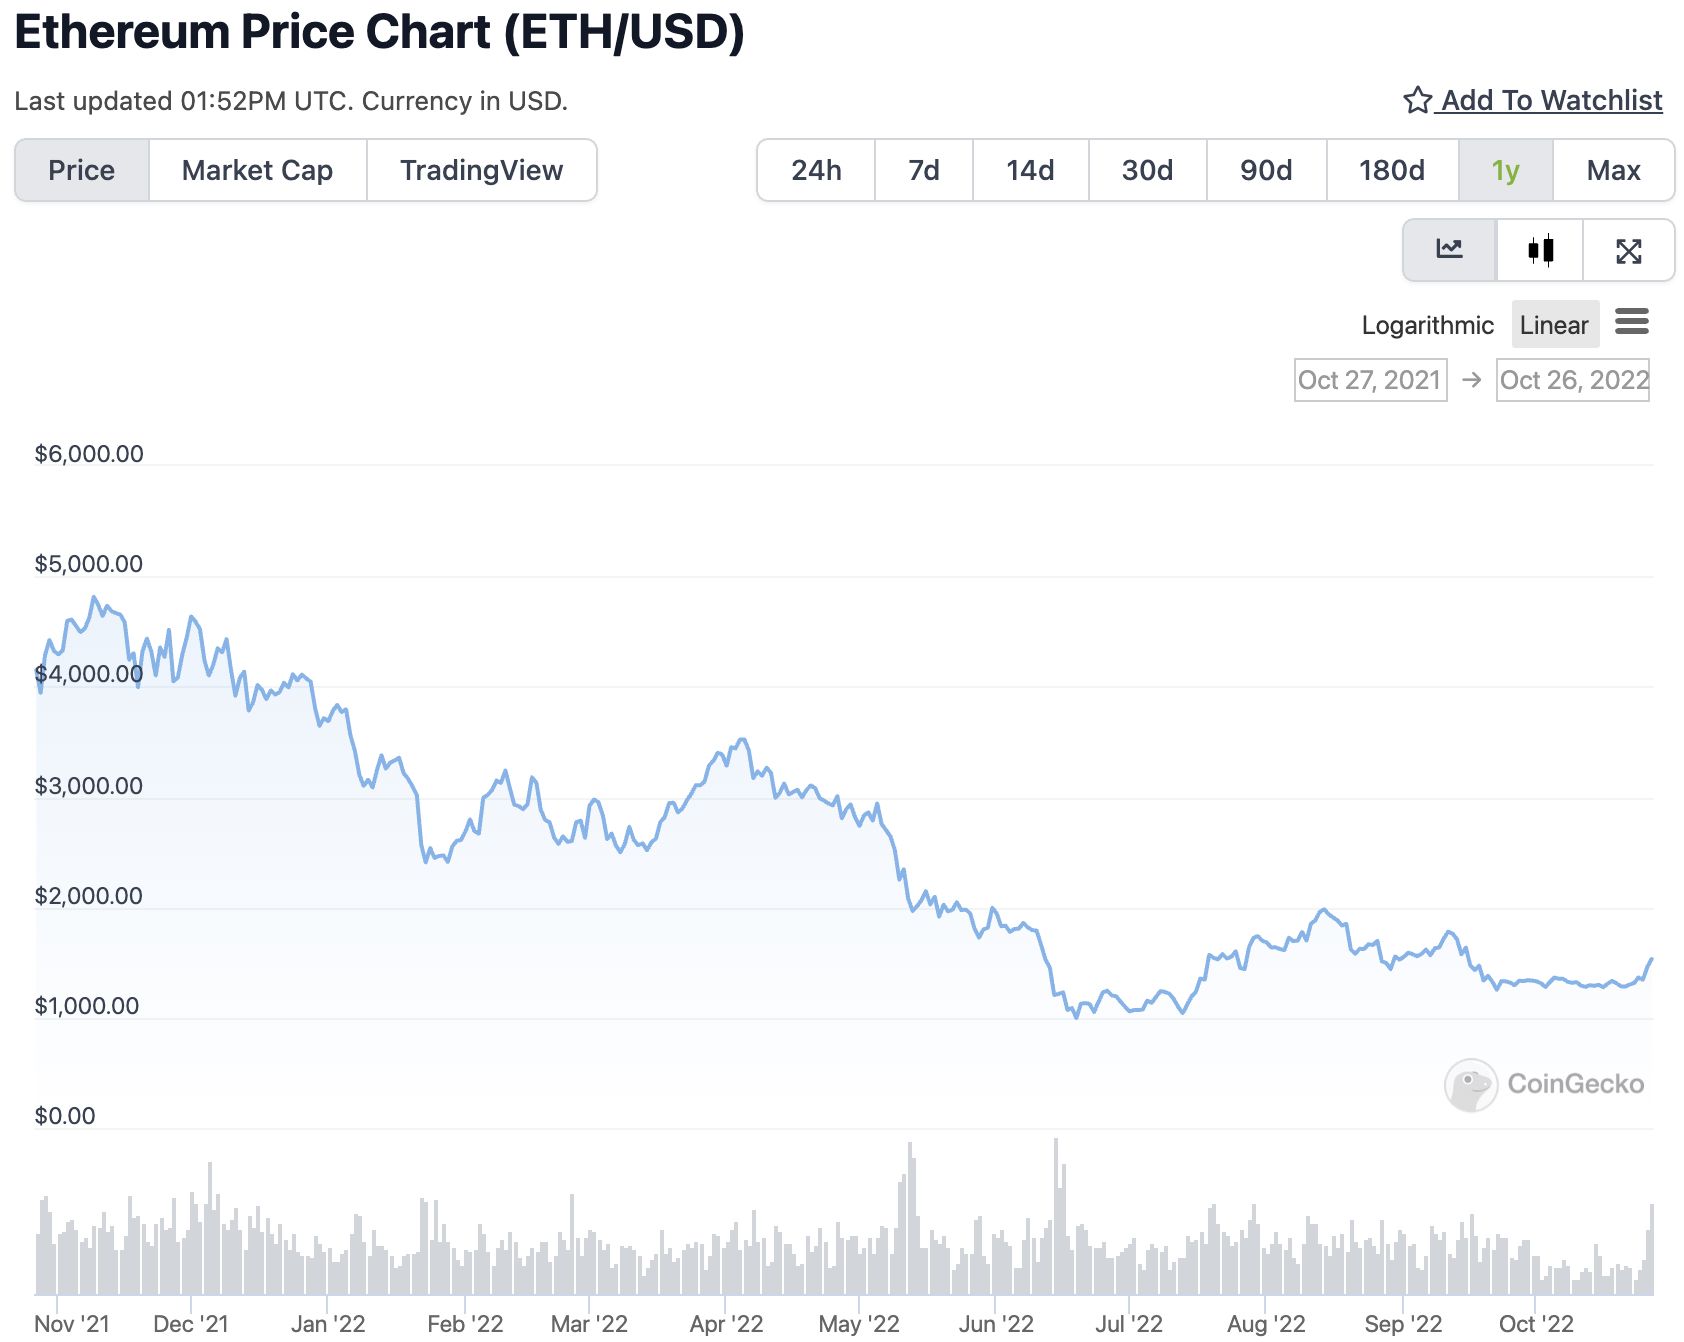
As we can see from Ethereum's past year of price movements, secondary trends have momentarily bucked a sustained bearish price movement throughout 2022, particularly between mid-January and late March.
Secondary trends typically last between three weeks and three months and are generally prompted by a short-term change in sentiment, news of network upgrades, or just about anything that can create a sustained, primary trend-bucking buzz surrounding an asset.
It's possible to anticipate a secondary trend by waiting for an indicator coupled with a rise in trading volume. One of the biggest reversal indicators is the "head and shoulders" formation, which occurs when three peaks appear on the chart, with the middle forming the largest.
By anticipating an emerging secondary trend, investors can hold on to their assets over a shorter-term span to grow their wealth or adopt a short position to later buy back the same coin at a lower price.
Embracing Tertiary Trends
Tertiary trends, otherwise known as "noise," are price movements that can last for less than three weeks. They generally occur when a news story causes investors to react, like when China announces tighter restrictions on crypto mining, for instance.
These trends can be great for fast-acting traders who can quickly spot a cause for a change in sentiment and profit from it, but for more long-term-focused investors, this noise can be ignored.
Tertiary trends can cause more pessimistic investors to falsely believe that a more sustained bearish movement is emerging, forcing them to sell their assets only to buy them back at a higher price when a longer-term trend resumes.
Spotting Trends Is Crucial For Crypto Trading
As always, investors need to stay vigilant when conducting technical analysis. Things can change quickly in the crypto world, and it's essential to spot the cause of primary, secondary, and tertiary trends before acting on them.
The information on this website does not constitute financial advice, investment advice, or trading advice, and should not be considered as such. MakeUseOf does not advise on any trading or investing matters and does not advise that any particular cryptocurrency should be bought or sold. Always conduct your own due diligence and consult a licensed financial adviser for investment advice.


