Error logs are an essential part of troubleshooting software, and almost all software is capable of producing them. If you are experiencing an unexpected problem when using Google Chrome, checking the error debug logs could help you diagnose the problem.
Unfortunately, it isn't immediately obvious if Chrome creates logs or where they are stored, let alone how to interpret them. Here's how you can use error logs in Chrome.
Is There a Chrome Error Log?
The simple answer is yes, but you need to enable Chrome error logging before they are created for you to use in your troubleshooting. There is no simple option in the Chrome settings to do this. Instead, you need to add a command line flag to tell Chrome to collect a log each time it is launched.
Sometimes also called command line switches, command line flags are a fairly easy way to run a program with special conditions. In this case, they are added to the Target field of the Chrome shortcut and are activated every time the app gets launched using that shortcut.
Error logs are different from crash reporting, which can be enabled from the Chrome settings. Crash reporting automatically sends details of any unexpected browser crashes to Google, to help them prioritize fixes and improvements.
If you want to enable crash reporting, in Chrome go to Settings > You and Google > Sync and Google services, and enable Help improve Chrome's features and performance. You can view a list of crash reports, but not their details, by going to Chrome://crashes.

There are several reasons why Chrome might crash, hang, or otherwise behave strangely. If viewing the debug logs as described below doesn't help you solve the problem, our guide to why Google Chrome keeps crashing could help.
Enabling Chrome Error Logs
The exact way you enable Chrome error logging is slightly different depending on which operating system you are using Chrome on.
How to Enable Chrome's Error Logs on Windows
- Close any running instances of Chrome and then locate the Chrome shortcut.
- Right-click the shortcut, and click Properties. If you have the Chrome shortcut pinned to the Taskbar, you will need to right-click it, then right-click Google Chrome again in the jump menu, before clicking Properties.
- If it isn't already selected, click the Shortcut tab and look for the Target field.
-
At the very end of the target line, add the following flag: --enable-logging --v=1.
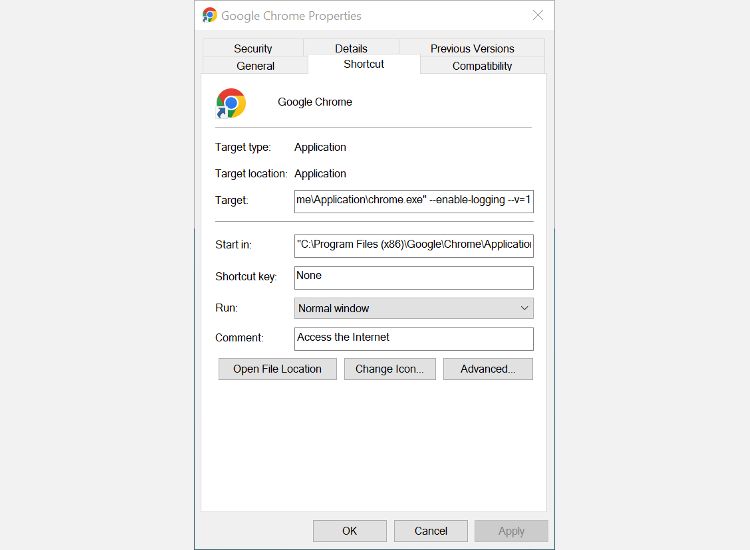
- You need to include the space at the beginning. Then click Apply and Ok.
- Launch Chrome using the shortcut, and see if you can reproduce the error you want to troubleshoot via the log.

How to Enable Chrome's Error Logs on macOS
- Close any running instances of Chrome on your Mac.
- Open the Terminal and run the following command: /Applications/Google\ Chrome.app/Contents/MacOS/Google\ Chrome --enable-logging --v=1.
- Press Return and then open Chrome to begin debugging.
If you are unsure about using Terminal in macOS, our beginner's guide to using the Mac Terminal will help.
How to Enable Chrome's Error Logs on Linux
- Make sure any running instances of Chrome are been closed.
- You then need to run a terminal emulator such as Terminator or Tilix Terminal.
- In the terminal, you need to run Chrome with the following flag added: --enable-logging --v=1.
You can find out more about choosing a good terminal emulator for Linux, which is a very useful tool to have at hand, in our guide to the best Linux terminal emulators.
Where to Find Chrome Debug Logs
Now that you have enabled Chrome error logs, you need to know where to find them. Chrome debug logs get overwritten each time you launch Chrome, so it is important to grab them after the problem has occurred, but before you open Chrome again.
Finding Chrome's Debug Logs on Windows
- Open File Explorer and click the View tab. You then need to check the box next to Hidden items. On Windows 11, go to View > Show > Hidden items.
- Now navigate to (C:)/Users/[your username]/AppData/Local/Google/Chrome/User Data. Scroll down, and you should see a file called chrome_debug.
- You can copy this file onto your desktop if you want to save the log from being overwritten when you open Chrome again.
- To view the debug log, double-click the file and select the program you want to open it with. Notepad works fine.

Finding Chrome's Debug Logs on macOS
- Open the Finder and navigate to Library/Application Support/Google/Chrome.
- On macOS, the file is called chrome_debug.log. You can double-click the file to open it in its location, or you can move it to the desktop to save it.
Finding Chrome's Debug Logs on Linux
- Open your default home folder and navigate to /.config/google-chrome.
- The file will be called chrome_debug. You can open the file using notepad software, or you can save it to a new location to prevent it from being overwritten when you open Chrome again.
How to Read the Error Logs
If you need the logs to send to Google or a third party as part of a support ticket, you can save the file to your desktop and then attach it to the ticket/send where required. Reading the logs as they are created, and working out why the problem is occurring, will probably take some advanced knowledge of how Chrome works.

Each line of the log contains several pieces of information, running from left to right, including the process ID, thread ID, day, month and time, logging level, and source code filename.
You could search the log file to see if "ERROR" appears anywhere, usually in the logging level part of the line. Even if it does, this might not refer to the cause of the problem, but will be a good starting point.
You can also check for multiple repeated instances of the same process. If you see the same process repeated lots of times in quick succession, it could be a sign that there is a problem with that process.
Troubleshooting Chrome With Error Logs
Enabling Chrome error logs isn't as easy as it could be, and they can be very confusing when you do actually find them. But if you want to try troubleshooting a persistent problem Chrome is having, or if you need logs to attach to a support ticket, the error logs provide a lot of information and could be the key to making Chrome work as it should.