Writing code that works brings a sense of fulfillment. But it's often the opposite when you encounter errors.
Debugging, however, involves removing faults in your code that make your program behave in ways you don't intend.
And as with any other programming language, errors can waste valuable time while coding with Python. Unfortunately, you can't avoid them. So how can you understand and deal with them? These are some of the best ways you can debug your Python code.
What Are Python Exceptions?
Whenever Python can't interpret a code or a command, it raises an exception. Python exceptions are a set of errors that arise while Python executes your code.
Python raises exceptions for errors using the try and except block. Executable commands are typically inside the try block.
But when the code inside try fails, Python executes those inside the except block.
In essence, statements inside the except keyword are the exceptions to those in the try block, and Python raises them as errors.
Sometimes, a try...except block could contain several exceptions (except keywords). Invariably, this results in a chain of errors. And that explains the typical detailed errors you sometimes encounter in Python.
Exceptions can arise when you use a built-in function, a library, or a Python framework.
So even if you write the correct syntax, failure to play by the rules of the methods you're trying to use results in exceptions, which can get overwhelming at times.
For instance, you might have written about only five lines of code, but Python checks in with an error on line 200.
That happens because Python raises exceptions that have been pre-defined within the source code of the library, framework, or built-in method you're using.
Syntax Errors
Python raises a syntax error each time you write a code or a syntax it doesn't recognize. They're more traceable than in-depth exceptions.
You're likely to come across syntax errors more often if you're a Python beginner. But they're easy to deal with once you understand how to handle them.
How to Debug Your Python Code
There are several exceptions in Python. They may include indentation, type, and name errors, among others.
Exceptions can emanate from a single line or a faulty block of code. Unfortunately, there are no specific ways to deal with exceptions. But you can handle them based on instances and project type.
Some errors also raise several exceptions at once. Ultimately, you'll encounter these errors more often while building real-life applications.
Although exceptions are frustrating, they don't take much to figure out and resolve if you're patient.
You can use any or a combination of the following methods to debug Python.
1. Check the Error Description
One of the best ways to treat Python errors is to check the error description. Python usually states this on the last line of your error output.
For instance, unexpected EOF while parsing is always related to a missing parenthesis. However, invalid syntax connotes a wrong syntax somewhere, while AttributeError comes up when you try to call a wrong function from a class or an object.
There are many other exceptions that you can come across. Merely tracing the line where they come from and rewriting your code can be key.
2. Trace the Line Where the Error Comes From
Thankfully, errors are line-bound in Python. So if you encounter an error, pay attention to the line that Python is pointing to.
For example, the error in the example below is a type error because the code tries to concatenate dissimilar data types (a string and an integer).
That error, however, points to line 2 in the example code:
Code:
        db = open("output.txt", "a")
a = "Hello"+1
b = "How do you do?"
db.write(a+", "+b+"\n")
Error:
        raceback (most recent call last):
  File "C:\Users\Omisola Idowu\Desktop\Lato\soup\new.py", line 2, in
    a = "Hello"+1
TypeError: can only concatenate str (not "int") to str
Take a look at another error example below:
Code:
        def findTotal(a):
	for i in a
		print(sum(i)*2)
Error:
        File "C:\Users\Omisola Idowu\Desktop\Lato\soup\new.py", line 2
    for i in a
             ^
SyntaxError: invalid syntax
Here, Python is pointing at a syntax error on line 2. If you're familiar with Python, finding out the missing colon after the for loop should be easy.
3. Leverage the Trace Method on the Command Line
While you can debug Python using the built-in IDLE, you'll not likely use it when working with bigger projects.
So one of the best ways to debug Python is via the command-line interface (CLI). It's synonymous to running console.log() in JavaScript.
If you encounter an error during code execution, you can spin up your CLI and run the faulty script using the trace command.
It works by running a check on each line of your code and breaking up wherever it finds an issue.
To use this method, run your file like this in your command line:
python -m trace --trace file_name.py
While it's not practical to run your entire script like this, you can create a separate Python file, paste each block of code (one at a time) into that file, and then run each code separately.
Although it's not what you do during unit testing, it's still a form of unit debugging.
4. Test Your Code
Unit testing involves isolating some units (blocks or lines) in your code and testing them for metrics like performance, efficiency, and correctness. You can think of this as a form of quality assurance in programming.
In addition to exceptions, a bug can sometimes occur due to a wrong boolean, which may not raise an error, but can cause your program to behave abnormally in deployment.
Unit testing uses several debugging techniques to test and profile your code for correctness using the assert function. It can even check the time it takes your code to run and so on.
During production, you can create a separate Python file, usually called test.py, and test each unit of your code inside that file.
A unit test can look like this:
        data = {
"guitars":[
{"Seagull":"$260"},
{"Fender":"$700"},
{"Electric-acoustic":"$600"}
]
}

if len(data["guitars"])==2:
	for i in data["guitars"]:
		print(i)
assert len(data["guitars"])==2, "Length less than what's required, should be 3"
Because the length of the array is less than 3, Python raises an assertion error:
AssertionError: Length less than what's required, should be 3
5. Use Loggings
Checking for errors using logs is another way to debug your code. Python has a built-in logging library. It works by detailing how your program runs in the console.
Logging, however, is more helpful when your program is in its deployment stage. But while you can't view logs in the console when your app is in deployment, you can set up a Simple Mail Transfer Protocol (SMTP) to get your code logs as an email.
That way you know at which point your program fails.
6. Use the Standard Python Debugger
Python has a popular onboard debugger called pdb. Because it's built-in, simply importing pdb into your test file works.
The pdb module is useful for debugging crashing programs that end abruptly. The module works by executing your code post-mortem (even after your program crashes).
You can run a whole Python file or its unit using pdb. Once pdb starts, you can use it to check through each line of your code to see where the error lies.
To get started with pdb, open your Python file and initiate the debugger like this:
import pdb; pdb.set_trace()
You can then run your Python file via the CLI:
Python Your_Python_file.py
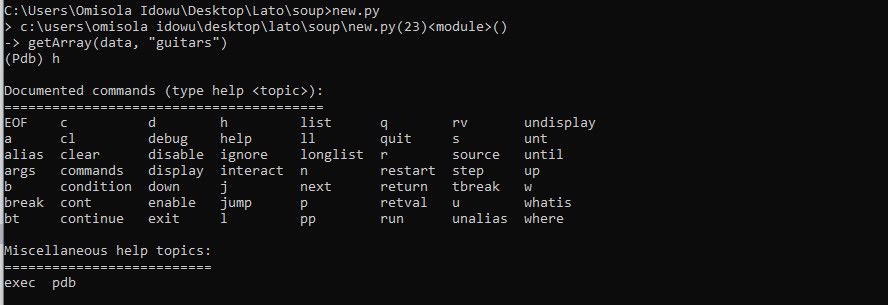
You'll see the pdb module in parenthesis in your CMD. Type h to view a list of available commands for pdb:
(pdb) h
The output looks like this:
For instance, list out your code line-by-line starting from the point of initiation:
(pdb) l
7. Debug Using IDEs
Integrated Development Environments (IDEs) are also valuable tools for debugging your Python script.
Visual Studio Code, for instance, with its Run and Debug feature and a language support plugin called Pylance, allows you to run your code in debug mode. Pycharm is another excellent IDE that can help you find faults in your code.
Eclipse also offers a third-party plugin called Pydev for debugging your Python scripts easily.
8. Search the Internet for Solutions
The internet is also a reliable resource you can look to for solving issues with your Python code, thanks to the Python developers' community.
Stackoverflow, for example, is a popular coding community where you can ask questions and get answers. You'll even find that most problems you may encounter have their solutions all over the platform already.
Additionally, YouTube contains a ton of coding videos that you can leverage.
Debugging Is Beyond Getting Rid Of Errors
Errors are an integral part of coding, but knowing how to handle them makes you stand out and helps you code faster. Debugging, however, goes beyond removing errors. Sometimes you may even have a working code that performs poorly; looking for ways to rectify pigeonholes is also a part of debugging.


