Whether you're new to data analytics or want to change careers, you need to know the best tools you can pick up quickly to get going. This especially true if you don't want to get your hands dirty with coding.
This article will focus on a handful of these tools that are great for newcomers.
Why Learn Data Analytics?
The job market for data analytics has grown massively as data collection has grown. It's becoming a necessity for every company (and even some individuals) to make data-driven decisions.
However, the data analytics tool you decide to learn matters a lot. You don't want to learn something that's not in demand. Most importantly, it all depends on what you intend to do with the data analytics tools you decide to pick up. As we've discussed before, data analytics has many applications and processes.
If you aim to use it for something related to an academic or survey data analysis, you can pick up simple tools that don't have complex interfaces. Examples of these are Minitab, SPSS, and Stata. Don't underestimate them---these tools are highly valuable too.
But if you'd like to dive into business analytics, you also have a lot of Business Intelligence tools to choose from.
These tools thus generally fall into two categories; Business Intelligence tools and statistical analysis tools. Let's take a look at examples for each of them.
Business Intelligence (BI) Tools
Business Intelligence is a broad term that involves the transformation of data to generate deeper and actionable insights from it. It's often used in the context of trends and changes in business performance.
Businesses use BI to monitor competitors' activities, control the price of commodities, and analyze market clusters to study consumers' behavior. It has helped small, medium, and large businesses to stay more competitive.
Let's consider three of the most-used Business Intelligence tools you can easily pick up, along with some of their main features.
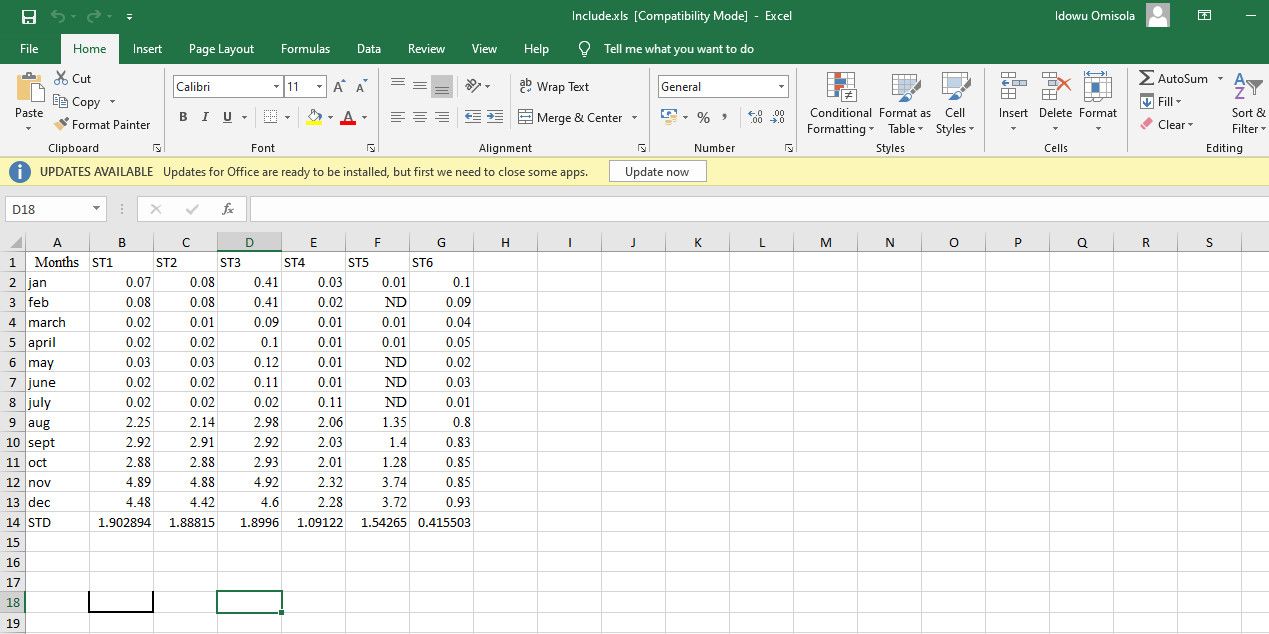
1. Microsoft Excel
Some people fear that Excel might get dumped for other BI tools after it becomes obsolete. That's not even close to the truth. Excel is in high demand and will continue to be so for as long as BI exists.
Since the launch of Microsoft Excel in 1985, the tool keeps scaling with every major Office update. With some work, you can achieve almost anything in Excel.
One of the major factors companies consider before leveraging a BI tool is the availability of experts for it. And because Excel is as old as BI, many have mastered it and can solve all kinds of problems with it.
As it's an easy-to-pick-up tool, the community for Excel is vast. Due to its simplicity and friendly interface, lots of companies still use Excel today. It's also a relatively affordable tool.
All this means you a large Excel community to learn from.
The ability of Excel to collect data from multiple sources, create amazing stories through great visualizations, and its RDBMS power pivot features are a few of the uses that Excel offers.
And with Microsoft 365, Excel receives upgrades all the time. Recent updates have included new functions, data types, pivot table layouts, chart types, and a lot more.
Excel is a good candidate because it's easy to reach an advanced level of understanding in a short period. Skills with it will be put to good use almost anywhere.
For a fun example of how to use Excel, check out how to find out interesting historical musical data.
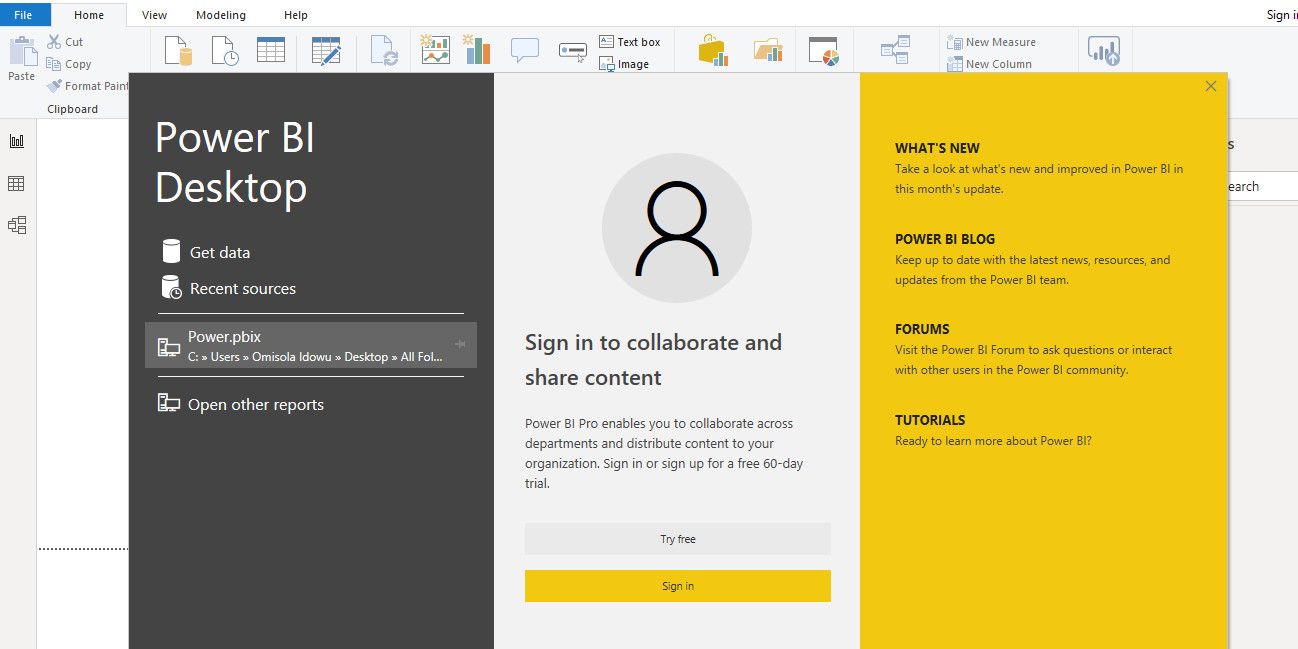
2. Microsoft Power BI
Microsoft Power BI is a scalable BI tool released by Microsoft in 2014. The initial release of Power BI was included in Office 365 as a Microsoft Excel add-in, until it was deprecated and released as an independent BI tool in 2015.
Power BI uses cloud-based services with a combination of the Power BI Desktop (which you can download from the Microsoft PowerBI Desktop Store) to serve its clients. And despite being a new tool, its popularity among companies has been huge. Many companies have turned to Power BI for data-driven solutions.
One of the main reasons for this growing trend is the speed and efficiency of generating insights with Microsoft Power BI. It comes with better automation and features that make using the tool in business analytics a lot easier.
Power BI provides a dashboard where you can monitor data in real-time with all-around visualization. In addition to that, you can view and share your reports easily. Power BI is accessible from your desktop or through its SaaS-based cloud services.
When learning Power BI, you can focus on one or two aspects of the tool. Areas like data warehousing, data sorting, and feature engineering are some of the specific topics you can become an authority on.
In addition to those, automated machine learning is another great feature of Power BI used to train and validate data with data flows.
Apart from the simple DAX formulas of Microsoft Power BI---which you can learn pretty quickly---it has a simple interface that's easy to interact with. And the learning curve is highly flexible.
It's a tool that boosts your chances of landing a job in data analytics if you're good at it. That's especially the case if you're planning to change careers to analytics.
Microsoft also have a data analysis tool called Dynamics.
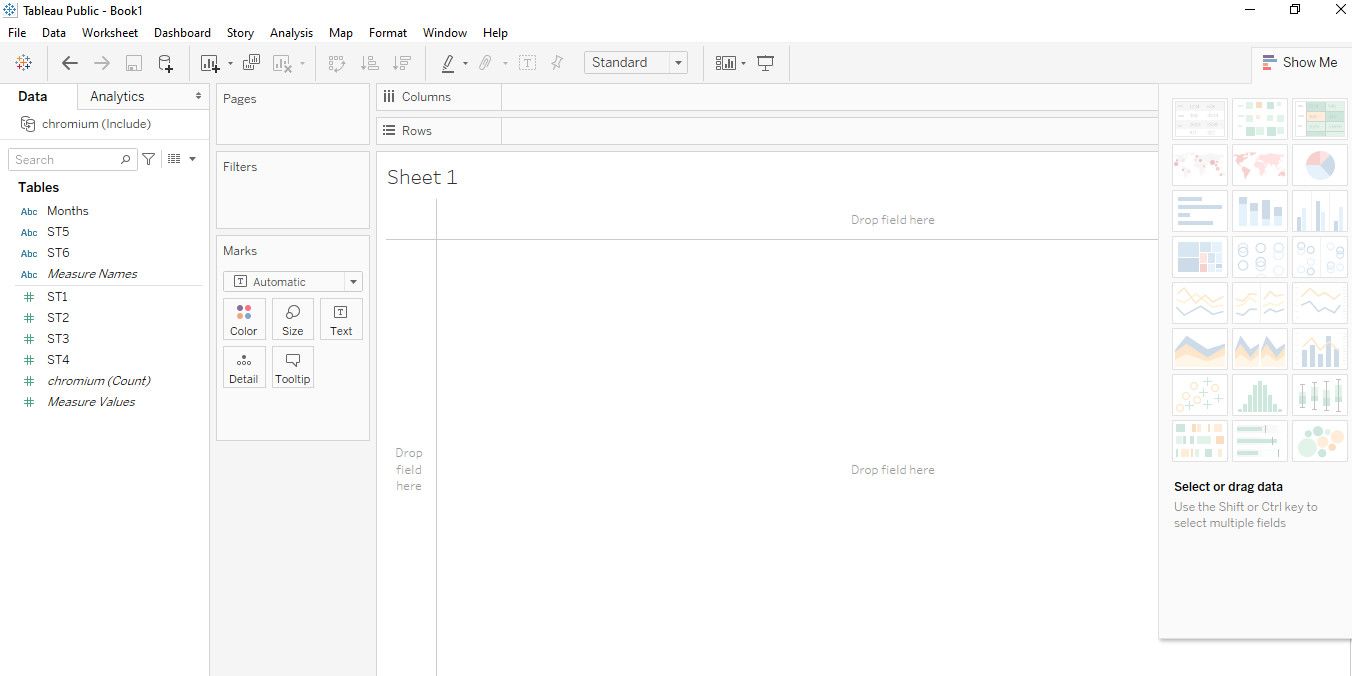
3. Tableau
Tableau is well-know for its amazing data visualization features. The tool was founded in 2003, and since its first official release in 2013, its popularity has continued to increase in many industries.
Tableau has three major software options: Tableau Desktop, Tableau Public, and Tableau Reader. These three options are in the Tableau learning curriculum. But there are slight differences between them.
Tableau Public is an open source BI tool that lets you share your visualization in real-time through a dashboard. It works with various data sources including CSV, Excel files, text files, and Google Sheets. You can get Tableau Public from the Tableau Public download site.
However, because of the open source nature of Tableau Public, it's impossible to save your workbook locally.
Tableau Desktop is a subscription-based BI tool for organizations or individuals that want instant and readily accessible analytics. You get to run and save your workbook locally, and your results are readily available.
Tableau Reader, on the other hand, isn't a visualization utility. It's a read-only tool that lets you send your visualizations to someone else, who can open your work in read-only mode.
If you like to become an expert in the geospatial aspect of Business Intelligence, Tableau might be the right tool to pick up. One of the valuable features of this tool its unique presentation of geographical data.
For any Tableau platform you choose, you get to view geographical clusters on maps and charts in a much simpler way. It's also a valuable tool in big data analytics.
The simplicity of Tableau, the need for skilled Tableau experts in industries, and the vast community that's available to solve various Tableau problems is enough a reason to pick it up.
Statistical Analysis Tools
Statistical analysis tools are more valuable in academic research. This doesn't make them less useful in Business Intelligence, though; there's some overlap between uses. Our classification of these tools is mainly based on their popularity.
Let's take a look at some academic-related research analytics tools below.
4. SPSS
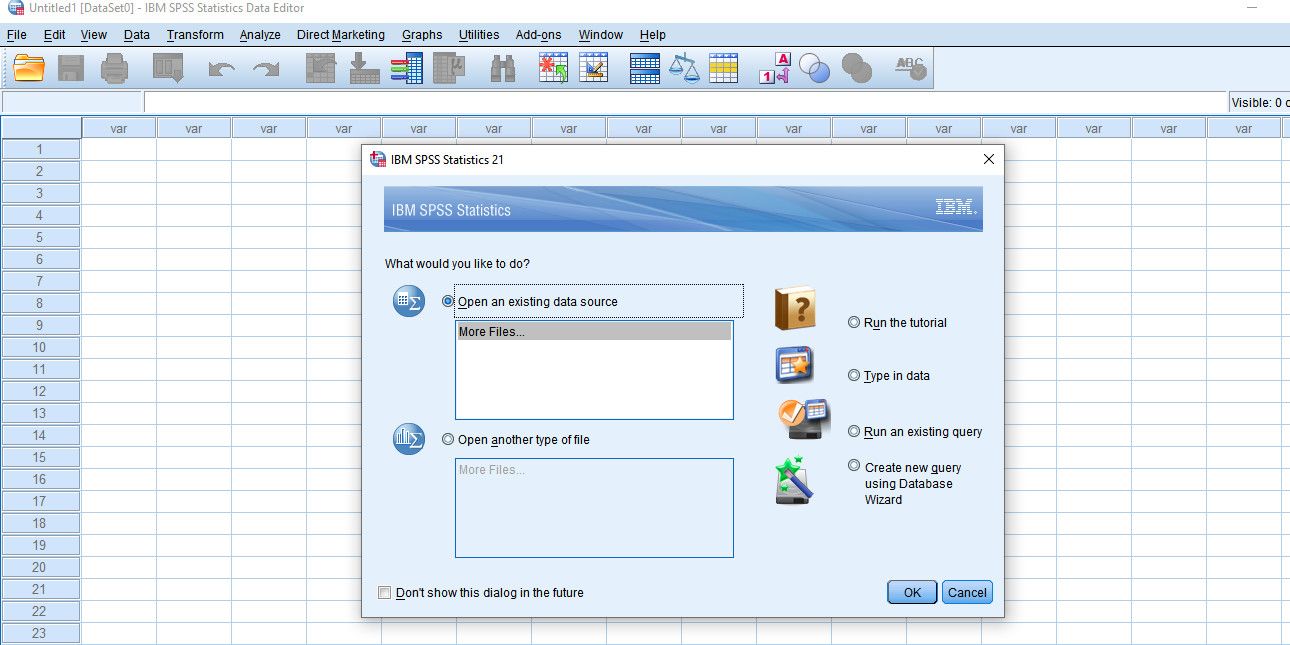
SPSS is the short name for the Statistical Package for Social Sciences. Its first version was made in 1968, making it one of the oldest statistical tools. However, it was acquired by IBM in 2009.
SPSS has in how far it can go with analyzing data. But at least, for now, it's still indispensable in academic research and social sciences. It's a valuable statistical test package that's pretty easy to use.
It has a simple interface, allowing any to master it quickly. If you're diligent, you can learn it without supervision.
This package operates across three interfaces: a Variable View where you get to input your data, a Data View for viewing your inputs, and a Result Sheet that displays your statistics.
While there may not be many opportunities for SPSS experts in the Business sphere, many non-governmental organizations (NGOs) need people skilled in it. Some industries still use it for experimental data analysis as well.
SPSS doesn't do well with visualizations. But if you like to analyze survey and experimental data, SPSS could be a great fit.
5. Stata
Stata came a bit later than SPSS; it was first released in 1985 by StataCorp. It's a statistical package that prioritizes simplicity.
Stata has almost the same interface as SPSS, but the type of statistics you is entirely different than that app.
Most NGOs prefer to hire Stata experts or an analyst with a combination of knowledge on SPSS, Excel, and Stata. So going for this tool is a good use of time.
Stata has unique syntaxes, but its menu interface and dialog boxes come in handy for beginners. The tools are pretty easy to use and interact with. Keep in mind that mastering the syntaxes down the line makes you more proficient with the tool, though.
Unlike SPSS, this tool is useful for visualizing experimental and survey data. That's one of the reasons for its popular use in NGOs.
Is it Enough to Just Learn Data Analytics Tools?
These data analytics tools are a great start. But beyond just learning the tools that make data analytics faster and easier, it's necessary to master the science of statistics itself.
Most of these tools still require you to know how to achieve what you want from them. You can do this by first mastering the significance of each command and menu on a tool.

