When you're dealing with numbers and digits, charts are the way to go for visualizing data. But what if you're dealing with coordinates and locations? Contrary to popular belief, data visualization in Google Sheets isn't all just graphs and charts. You can visualize your data with a custom map in Google Sheets.
Maps aren't as flexible as charts, as you can't use them to represent most things. However, maps are incredibly convenient in particular scenarios, such as displaying the locations of your customers, tracking sales, or planning a trip.
Google Sheets doesn't have this feature built into it, but you can install it as an add-on. Let's talk about how you can install and use this add-on to create maps in Google Sheets.
How to Create a Map in Google Sheets
Although Google Sheets and Google Maps are both Google tools, they can't directly work together by default. Fortunately, Google Sheets add-ons can bridge this gap and allow you to use Google Maps in useful and unique ways.
To create a map in Google Sheets, you will need to install the Mapping Sheets add-on. Once you've got Mapping Sheets ready, you can create a spreadsheet with appropriate data and then build and view your custom map.
1. Install the Mapping Sheets Add-On
Mapping Sheets is a free add-on that allows you to create custom maps from your Google Sheets data. This add-on takes in the data in your spreadsheet and then builds a custom map with markers on specific locations. You can install Mapping Sheets from Google Sheets itself.

- Open a new or existing spreadsheet in Google Sheets.
- Go to the Extensions menu and select Add-ons.
- Click on Get add-ons. This will open the Google Workplace Marketplace.
- In the marketplace, search for Mapping Sheets and click on it.
- Click on Install and then allow the necessary permissions.
You should now see a new item called Mapping Sheets under the Extensions menu.
2. Create Your Spreadsheet
Now it's time to create a spreadsheet with the data you want to map. Your spreadsheet can have as many columns and rows as you want. However, Mapping Sheets requires at least three columns of data to function correctly: Name, address or coordinates, and category.

Take the spreadsheet above as an example. This spreadsheet is a list of some people in an imaginary study, along with their residence coordinates, occupation, and gender. Since the main focus in this study is occupation, columns A to C contain the necessary information to create the map.
You can add more columns to display additional information for each marker in your map. Just remember to include the essential ones.
3. Customize the Map
Although Mapping Sheets' default settings get the job done in most cases, you can customize your map to better suit your needs and add some style. Here's how you can customize the map:
- Go to the Extensions tab in Google Sheets.
- Go to Mapping Sheets and then select Preferences.
Mapping Sheets has an array of preferences you can adjust. Two of the tabs worth checking out are Map and Icons, where you can change the markers and elements on your map.

You can also give your map some zest by adding a map style in the Map tab. This is one of Mapping Sheet's best features, as you can make the looks of your map genuinely unique.
There are plenty of extensions and websites to make Google Maps incredibly useful. One such website is SnazzyMaps, where you can browse various map styles and copy the code for any you like. For instance, the code below will give your custom map vivid colors and remove the labels:
[ { "featureType": "all", "elementType": "all", "stylers": [ { "saturation": "32" }, { "lightness": "-3" }, { "visibility": "on" }, { "weight": "1.18" } ] }, { "featureType": "administrative", "elementType": "labels", "stylers": [ { "visibility": "off" } ] }, { "featureType": "landscape", "elementType": "labels", "stylers": [ { "visibility": "off" } ] }, { "featureType": "landscape.man_made", "elementType": "all", "stylers": [ { "saturation": "-70" }, { "lightness": "14" } ] }, { "featureType": "poi", "elementType": "labels", "stylers": [ { "visibility": "off" } ] }, { "featureType": "road", "elementType": "labels", "stylers": [ { "visibility": "off" } ] }, { "featureType": "transit", "elementType": "labels", "stylers": [ { "visibility": "off" } ] }, { "featureType": "water", "elementType": "all", "stylers": [ { "saturation": "100" }, { "lightness": "-14" } ] }, { "featureType": "water", "elementType": "labels", "stylers": [ { "visibility": "off" }, { "lightness": "12" } ] } ]
Make sure to add styled in the map Types. Remove all other types if you want the custom style to be the only way your map is displayed.
4. Build and View the Map
Once your spreadsheet and preferences are ready, you can build your map using Mapping Sheets.
- Go to the Extensions menu.
- Click on Mapping Sheets.
- Select Start Mapping.

This will open Mapping Sheets to the right. Here you need to select the appropriate headers for the map.
- Under Title, select the column containing the location labels. That's Name in this example.
- Under Filter, select the column containing the primary information. That's Occupation in this example.
- Under Location, select the column containing the coordinates. That's Residence in this example.
- Click on Build.
Mapping Sheets will process the data and generate a map. This may take a few minutes, depending on the size of your data and the speed of your internet connection. You'll get a messaging saying Map OK when the process is complete. Now click on View to see your map!

You can now explore your map and interact with it. Zoom in and out, pan around, click on any marker to see more information, and use the filters to narrow down your results.
5. Share Your Map
Your map's data and configurations are stored in a JSON file bound to your account. To share your map with others, you'll need to share the link to the map and the JSON file through Google. Mapping Sheets has made this process simple by providing everything you need.
- In Mapping Sheets, click the three vertical dots in the top-right corner.
-
Select Share my map.
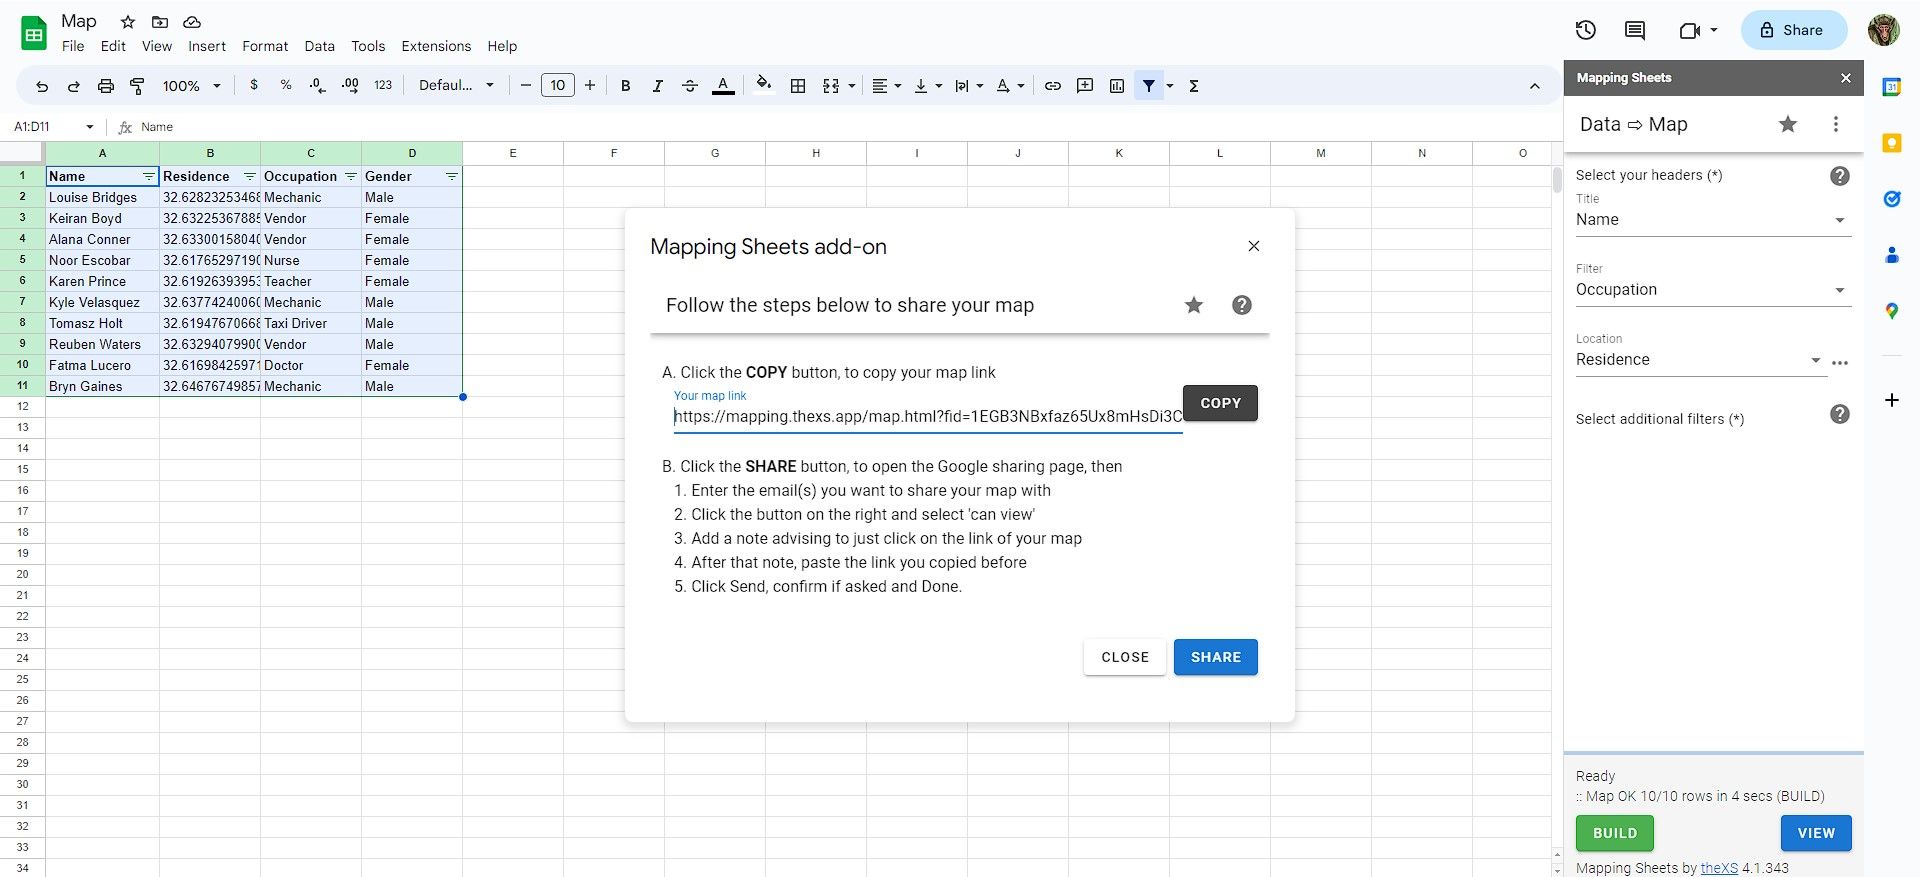
- Copy the link to your map.
-
Click the Share button. This will take you to your Google Drive.

- In your Google Drive, type in the email address of the people you want to share your map with.
- Paste the map link in the Message text box. Add a note that they need only click the map link.
- Click Send.


Now, the people you gave access to can view your custom map by visiting the map link.
Put Your Data on the Map With Google Sheets
Google Sheets and the Mapping Sheets add-on provide a powerful way to visualize your data on a map without any coding or complex tools. You can use this to create maps for personal or professional purposes, such as travel planning or keeping track of your shipments.
Now that you've learned how to create custom maps in Google Sheets, you can turn your spreadsheet data into interactive maps. Try it out and see what you can create!