Crypto trading charts can look intimidating at first. All the lines, candles, and indicators can be confusing. However, charts are actually relatively simple to read once you know what you're looking for.
With that in mind, we're going to cover the basics of reading crypto charts, different types of charts, important indicators, and common chart patterns. By the end of this guide, you should have a basic understanding of how to read crypto charts and what to look for when trading.
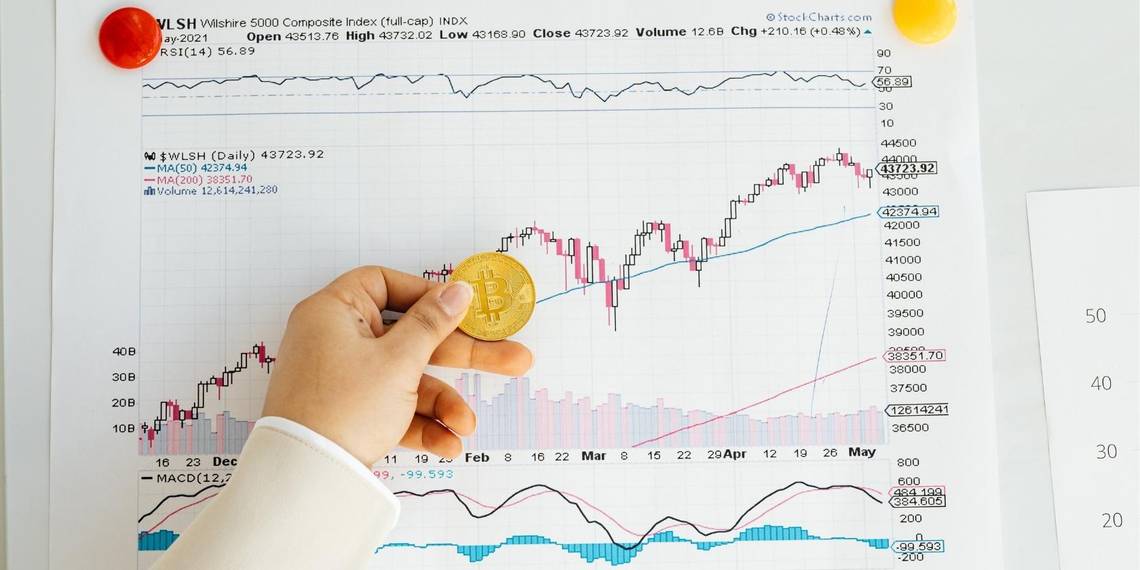
What Is a Crypto Chart?
A crypto chart is simply a graphical representation of data. In the case of crypto trading, this data is typically the price of a cryptocurrency over time. Crypto charts are used to track price movement, identify trends, and spot trading opportunities.
.jpg?q=50&fit=crop&w=1500&dpr=1.5)
There are many types of crypto charts, but the most common is the candlestick chart. Traders use candlestick charts to track price movement over time. Each "candle" on the chart represents a specific period, typically one day, but adjustable to different periods. The candle's body represents the open and close price for that period, while the wicks represent the high and low price. Green candles represent periods where the price went up, while red candles represent periods where the price went down.
What Are the Most Important Crypto Chart Indicators?
There are dozens of different indicators that traders can use to analyze crypto charts. However, most indicators can be grouped into two main categories: trend indicators and momentum indicators. Trend indicators are used to identify the overall direction of the market. The most popular trend indicator is the moving average.
Momentum indicators are used to identify when the market is overbought or oversold. The most popular momentum indicator is the Relative Strength Index (RSI). There are many other indicators that traders can use, but these are the two most important.
What Are the Most Common Chart Patterns?
Traders use chart patterns to identify potential trading opportunities. There are many chart patterns that traders can use to identify trading opportunities. However, some patterns are more common than others. Each pattern can give traders different information about the market, such as the direction and strength of a trend and potential reversal points.
If you're new to the crypto world, making sense of the market can be tough. But don't worry. Some tried and true chart patterns can help you navigate these waters.
1. Head and Shoulders
The head and shoulders pattern looks like this:

The head and shoulders pattern is one of the most reliable reversal patterns in all technical analyses. This pattern has been observed in crypto markets for years and is a reliable predictor of price movements. The head and shoulders pattern is characterized by a series of three peaks, with the middle peak being the highest.
This pattern indicates that the market is in a downtrend and that prices are likely to continue falling. However, there are a few things to look for when identifying a head and shoulders pattern.
- The three peaks should be of a similar height.
- The middle peak should be higher than the other two peaks.
- The pattern should be symmetrical, with the two shoulders having a similar height.
Once a head and shoulders pattern has been identified, traders can use it to predict future price movements.
2. Double Top
The double top is another bearish reversal pattern. It looks like this:

The double top pattern is a bearish reversal pattern found in the price charts of any market, including crypto. The pattern is created when the price of an asset reaches a new high, pulls back, and then fails to reach the previous high.
The double top chart pattern is considered a reliable bearish reversal signal, as it shows that the bulls could not maintain the asset's price at its previous high. This pattern can be found in any time frame but is most commonly seen on longer-term charts.
The double top pattern is usually completed when the price falls below the support level created by the pullback between the two peaks. This level is typically referred to as the "neckline." Once the neckline is broken, traders often use technical analysis tools to determine where the price will likely head next. One popular target is the distance between the highs of the two peaks, which is typically measured using Fibonacci retracement levels.
As you can see, the double top is very similar to the head and shoulders pattern. The main difference is that there are two "tops" instead of one. The double top is created when the market rallies to a new high, retraces back to support and then rallies back to the same high a second time. This second rally typically fails, leading to a sell-off.
3. Triple Top
The triple top is a bearish reversal pattern that looks like this:

The triple top is very similar to the double top. The main difference is that there are three "tops" instead of two. The triple top pattern is created when the asset price reaches a peak and then declines to a trough three times before finally breaking below support.
This pattern is thought to be a sign that the asset is no longer gaining strength and may be poised for a significant sell-off. The first peak is typically followed by a trough, followed by a second peak. The second peak is usually followed by a second trough, which is then followed by a third peak. After the third peak, the asset's price typically breaks below support, signaling a potential sell-off.
The triple top pattern is often viewed as a bearish signal, indicating that the asset is losing momentum and may be poised for a significant sell-off. This pattern can be used to identify potential selling opportunities. When trading cryptocurrencies, it is important to be aware of the triple top pattern, as it can help you make more informed decisions about when to sell.
These are just three of the most common chart patterns that can help you make sense of the market. So, next time you're feeling lost, look at the charts and see if any of these patterns are present.
Learn How to Read Crypto Charts to Make Better Trades
The crypto market is full of opportunities for those who know how to spot them. Chart patterns are one tool that can be used to identify these opportunities. While there is no guarantee of success, knowing how to read and trade chart patterns can give you an edge in the market.
Reading crypto charts is relatively simple once you know what you're looking for. However, learning how to read charts and identify trading opportunities can take some time.