Standard deviation is a measure of how clustered or spread out the data is compared to the mean. By calculating standard deviation, you can get a numerical scale of how dispersed your data is.
Though you can manually write a formula that calculates the standard deviation of a data set in Google Sheets, you can also skip the hassle by using the STDEV function. Read on to find out how you can use the STDEV function to calculate standard deviation in Google Sheets.
STDEV Function in Google Sheets
Google Sheets uses the same formula to calculate standard deviation as Excel, which is rather complex. Fortunately, the STDEV function is straightforward to use. The syntax for this function is as below:
=STDEV(value1, value2, ...)
The STDEV function takes in the cells that you want to include in your sample and then calculates the standard deviation for that sample. You can enter single cells or ranges of cells as values for STDEV.
If your desired sample doesn't fit in a single range, then you can add a range and then single cells like the below formula:
=STDEV(A1:C11, E8, G2)f
The STDEV function does not work on text values, so if you have indicated a cell that contains text in your sample, STDEV will ignore it. You can also input numbers, instead of cells, in the STDEV function.
How to Use the STDEV Function in Google Sheets
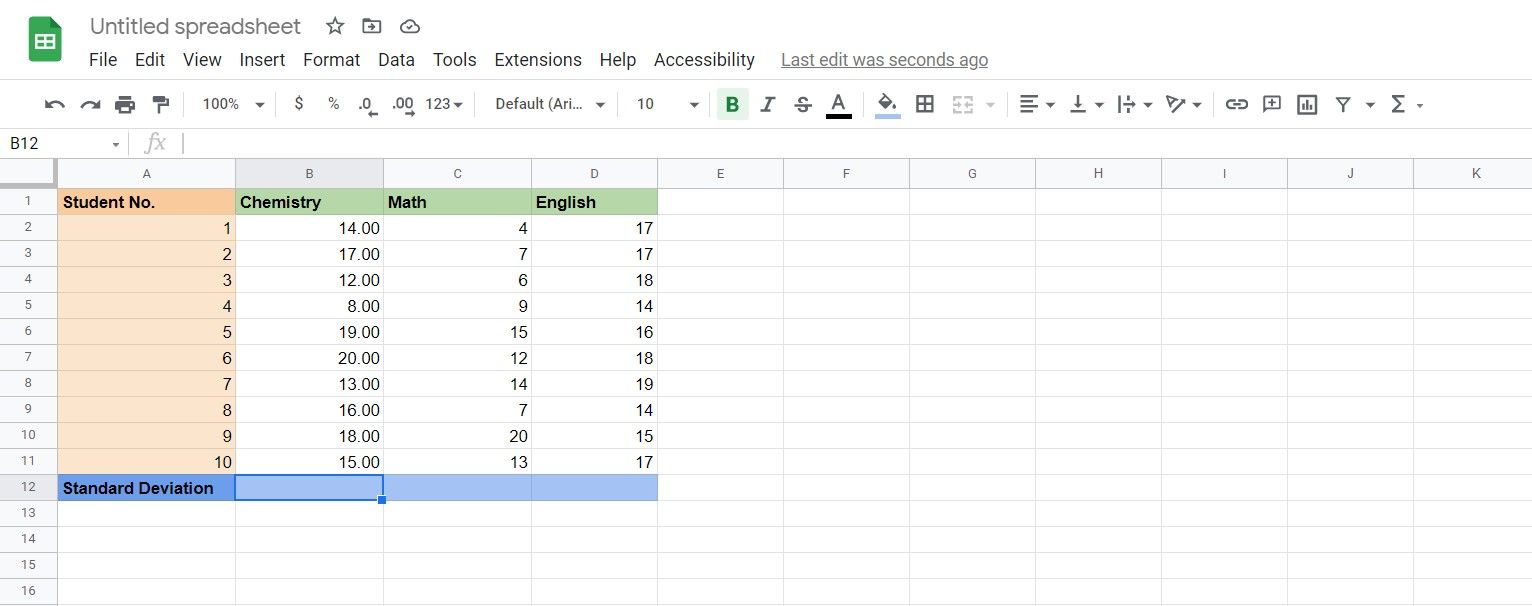
Now let's see the STDEV function at work. As an example, we have the marks of ten students on three different subjects in this spreadsheet. The goal is to calculate the standard deviation for each of these subjects and find out which subject has more uniform marks.
- Select the cell where you want to show the standard deviation. In this example, we're going to select cell B12.
-
In the formula bar, type the formula below:
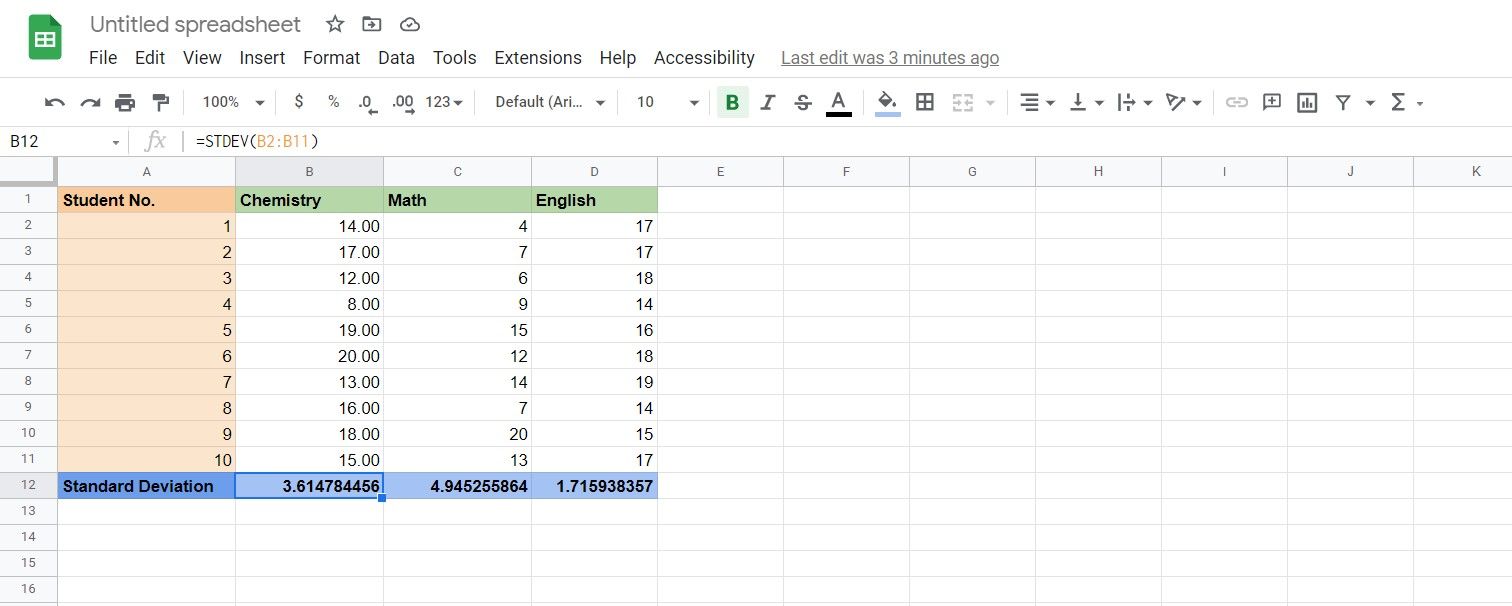
=STDEV(B2:B11)
This formula calls on the STDEV function to calculate the standard variation for the numbers in cells B2 to B11. Replace B2:B11 with your desired cell range. - Press Enter. Google Sheets will now calculate the standard deviation for that column.
- Grab the fill handle and drop it on the cells where you want to calculate the standard deviation. That will be cells C12 and D12 in this example.
Now we have the standard deviation for all three subjects. A small number represents a clustered dataset, while a bigger number represents a dispersed dataset.
Looking at the numbers in this example, you can tell that the students are more or less on the same level when it comes to English, but there's a significant difference between the student's capabilities when it comes to math.
Analyze Your Data With Google Sheets
Standard deviation is an important measure in statistics that lets you see how packed or dispersed your data points are from the mean. The formula for calculating standard deviation is sophisticated and time-consuming, but Google Sheets can do it all with a single function.
Using the STDEV function, you can instantly calculate the standard deviation of a series of data by simply entering the numbers or range of cells for your sample. Once more, Google Sheets has proven it can make life easier. Customizing Google Sheets itself can give you an even greater boost in productivity.


