Adding charts to your user interface helps you tell stories in a visually compelling manner. But how do you do achieve this without writing long-form code from scratch? It's easy. All you need is a suitable JavaScript chart library to turn your data into finished plots.
Whether you want to create real-time charts or need to show your users a historical trend, these are the best JavaScript libraries you can use.
1. Chart.js
Chart.js is an open-source JavaScript library for making HTML-based charts. It's one of the simplest visualization libraries for JavaScript, and it features support for line, bar, scatter, doughnut, pie, radar, area, and bubble charts.
One of its unique features is its ability to animate and customize charts to fit the experience you want for your user interface (UI). Chart.js is also pretty straightforward to integrate. Whether you're writing vanilla JavaScript or using a front-end stack like React or Angular, all you need to do is install Chart.js as a package or call it from the CDN.
Ultimately, it accepts an X and Y array, and the whole code runs inside a simple object logic to render your chart to the front-end in HTML canvas based on the data it reads. And you can combine charts if you want.
2. Recharts
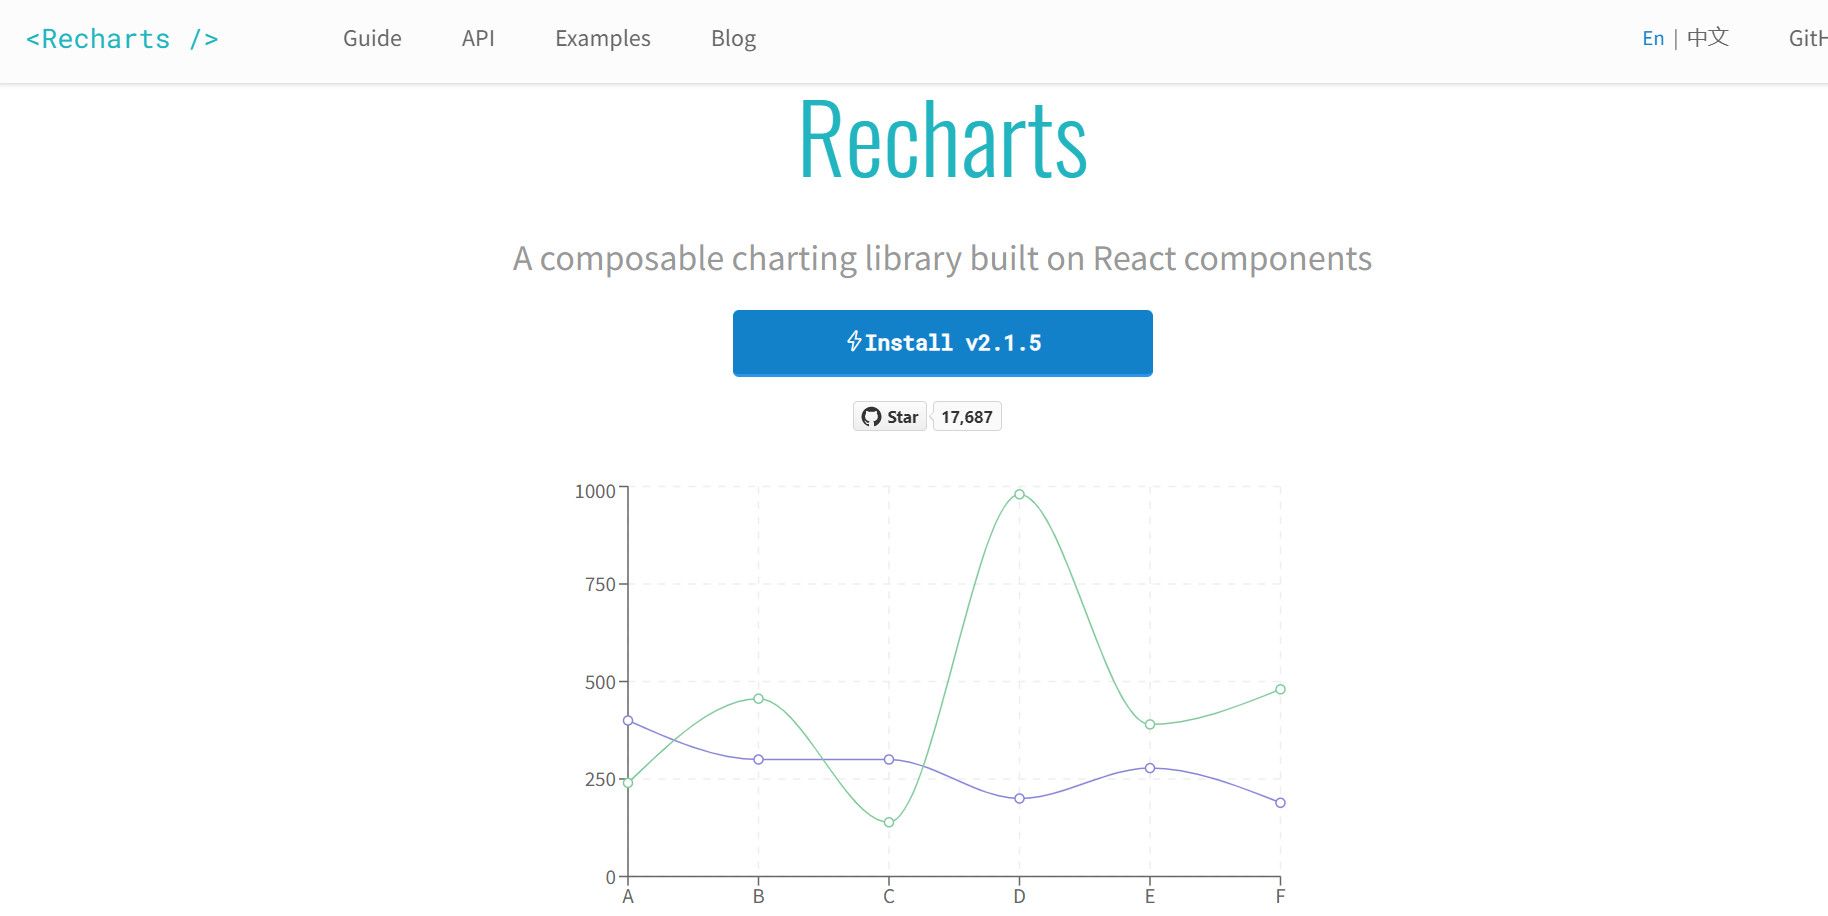
Here's a handy JavaScript chart library for React programmers. Built with a combination of React and D3.js, Recharts uses scalable vector graphics (SVGs) to render charts primarily in React. So, if you're using Vanilla JavaScript, you might want to consider other chart library options.
The library supports 11 chart types. And in addition to being a React component itself, every part of a rendered chart in Recharts, including the legend, axes, and more, is an independent component inside a parent.
Consequently, you can customize each component by manipulating props as you like. This means you can easily plug and decouple parts of the chart from the whole without affecting other React components.
3. CanvasJS
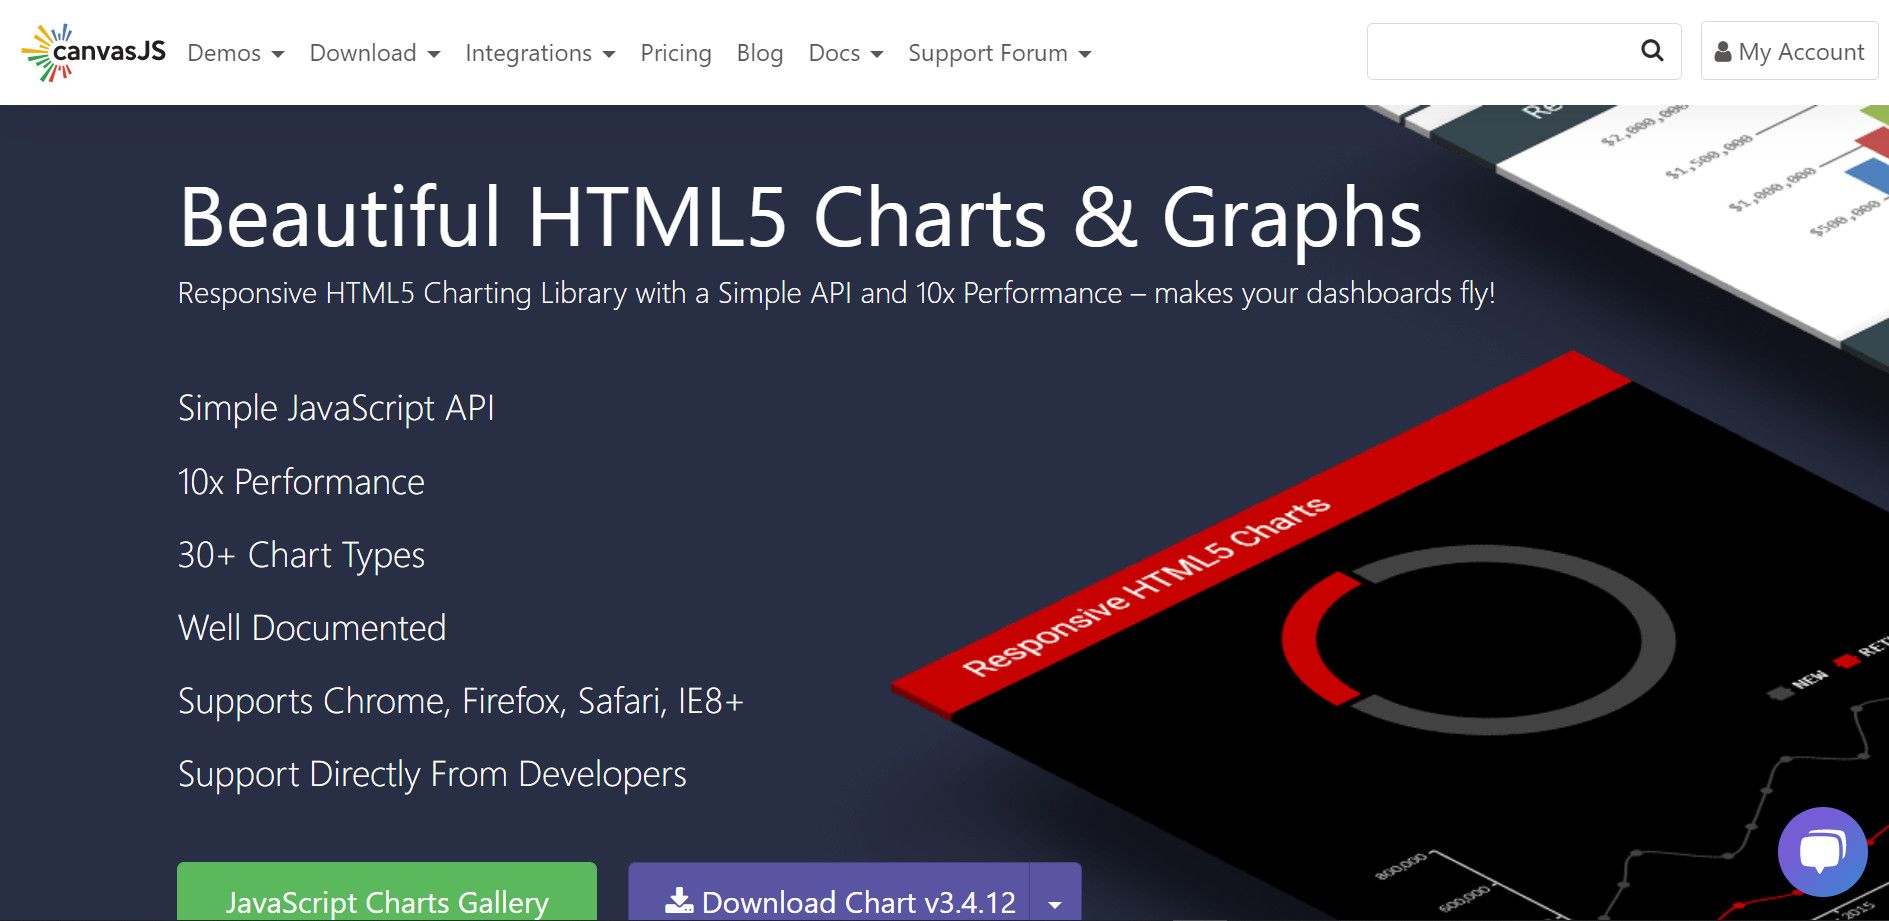
CanvasJS is versatile, fast, simple, and features up to 30 chart types that are rendered in HTML divs rather than a canvas. It’s also highly customizable, with support for animation and chart combinations. One of its unique features lets you change your chart theme dynamically in the UI.
In addition to JavaScript front-end frameworks, it supports chart rendering in server-side technologies like PHP, ASP.NET, and MVC stacks. It also provides easy workarounds in the docs for different scenarios.
The library even comes from a professional angle as a dashboard tool for visualizing data from various perspectives. It's easy to plot stock-related charts with canvasJS. And ultimately, it has separate CDNs for stock and general charts.
4. D3.js
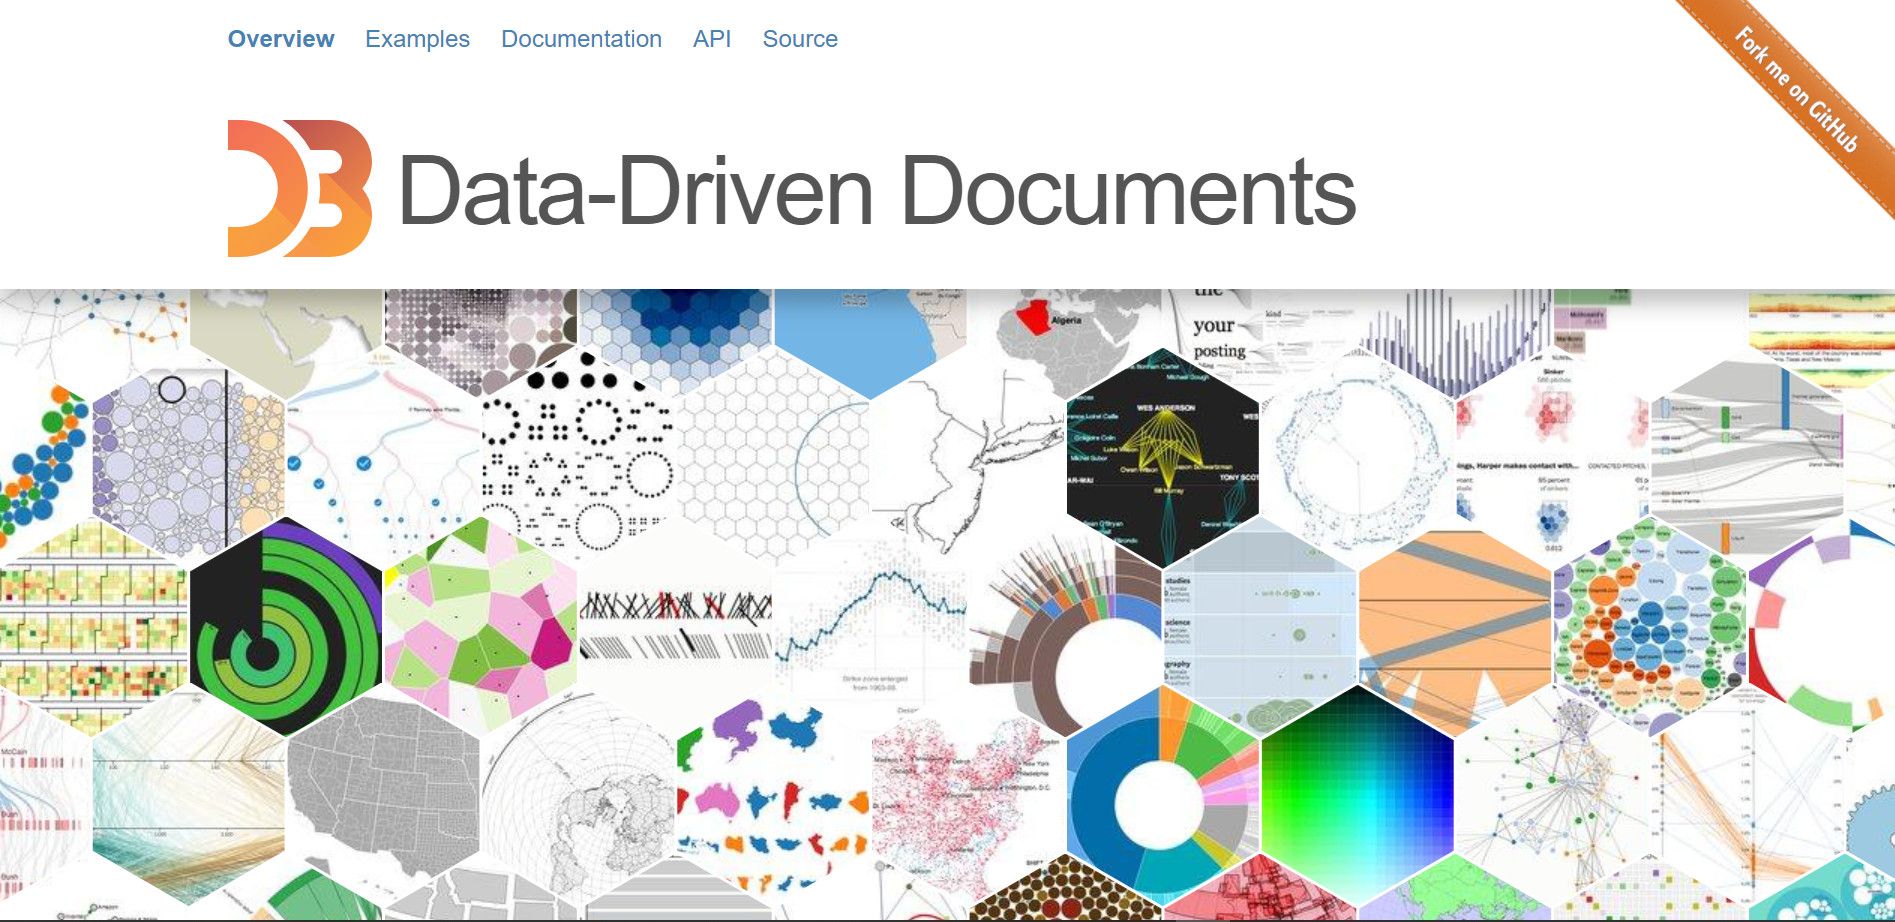
If you don't mind getting your hands dirty creating an SVG and declaring axes from scratch before plotting the actual chart, you might want to check out D3.js for drawing graphs on your website. Although it's more verbose than other JavaScript chart libraries, it gives you a better grip on the chart area and its content.
The fact that it's powerful and operates at a lower level than other JavaScript chart libraries makes it an ideal tool when performance is the utmost goal. Its API offers built-in CSS attributes that let you style your charts as you like.
And because you have control over the SVG container, you can design the graph theme to suit your UI design. D3.js might be technical when you start. Ultimately, once you know your way around it, you can plot just about any type of chart with it.
5. Google Charts
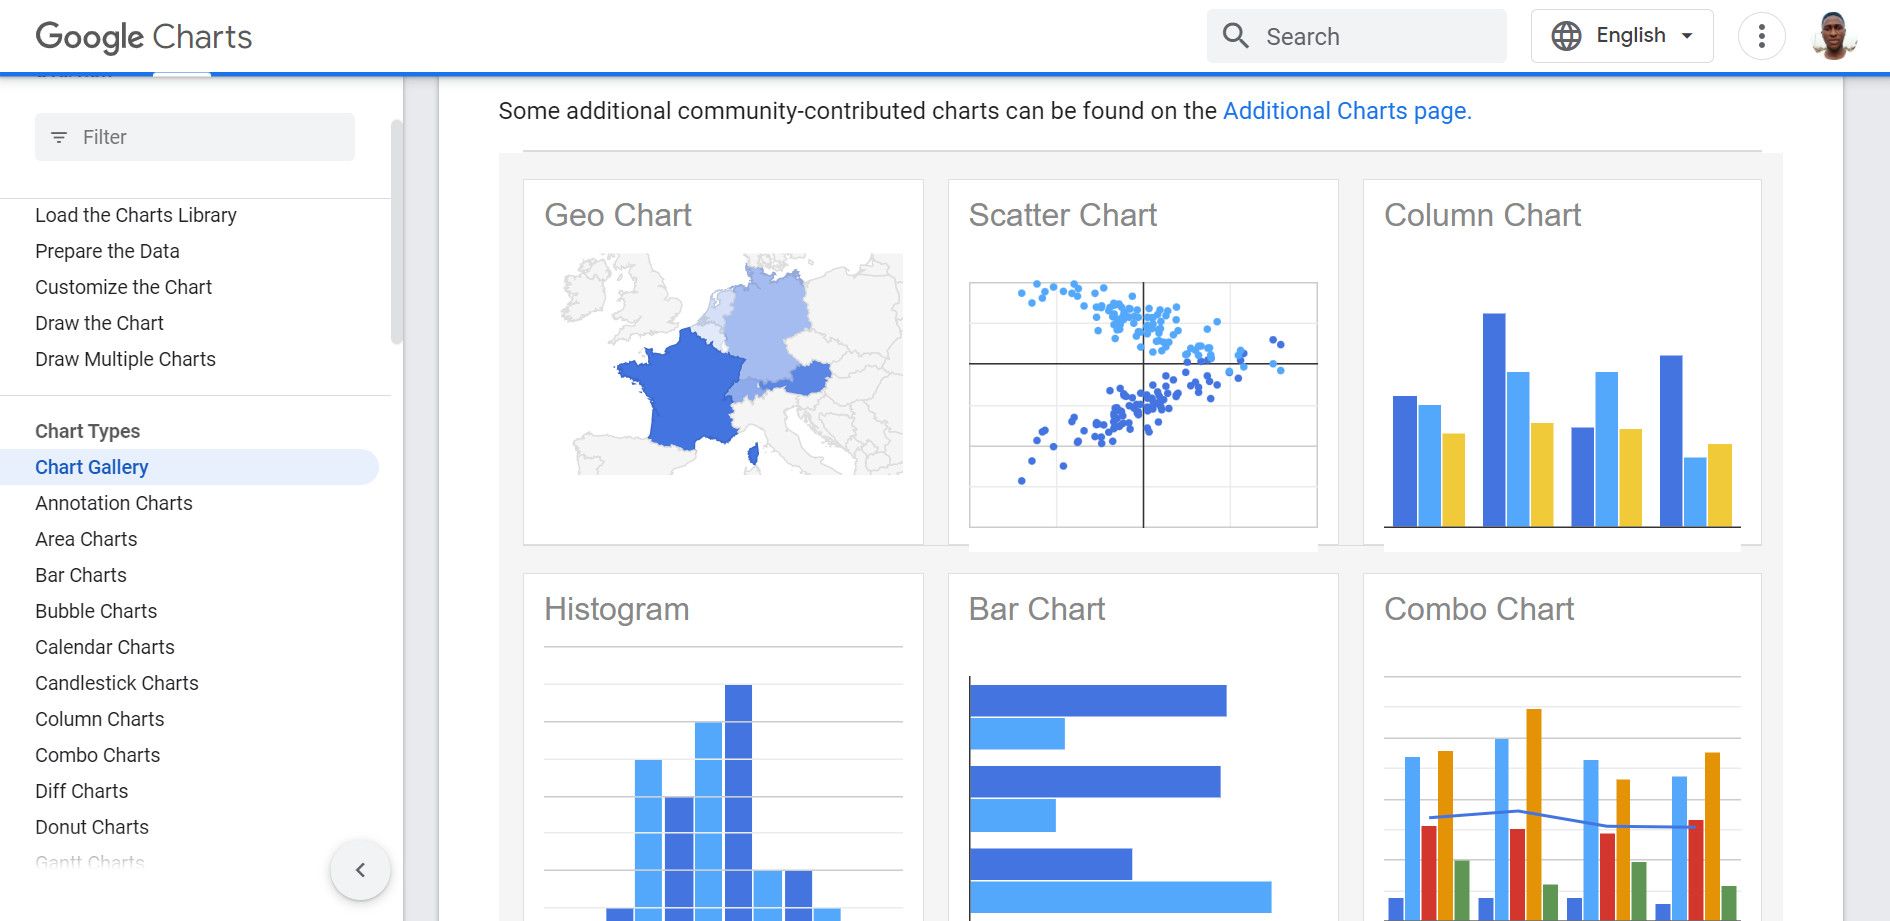
Google Charts uses HTML5 and SVG to write custom graphs to the Document Object Model (DOM). It's easy to use and provides enough examples in its documentation that you won't feel lost along the way. It also offers an avenue for connecting to various data sources that supports the chart tool protocol.
It provides a DataTable class that makes it easy to split, filter, and modify your data into separate arrays of columns and rows. The library also removes the need for additional computation while coding a chart. For instance, you don't need to calculate the percentage distribution of your data while plotting a pie chart. It does this for you.
Each chart type in Google Charts comes as a JavaScript class, and you can easily assign the data object and customization options to separate variables. Hence, it lets you pass them separately to the main chart class. Indeed, its logic is neat and comprehensive.
6. ApexCharts.js
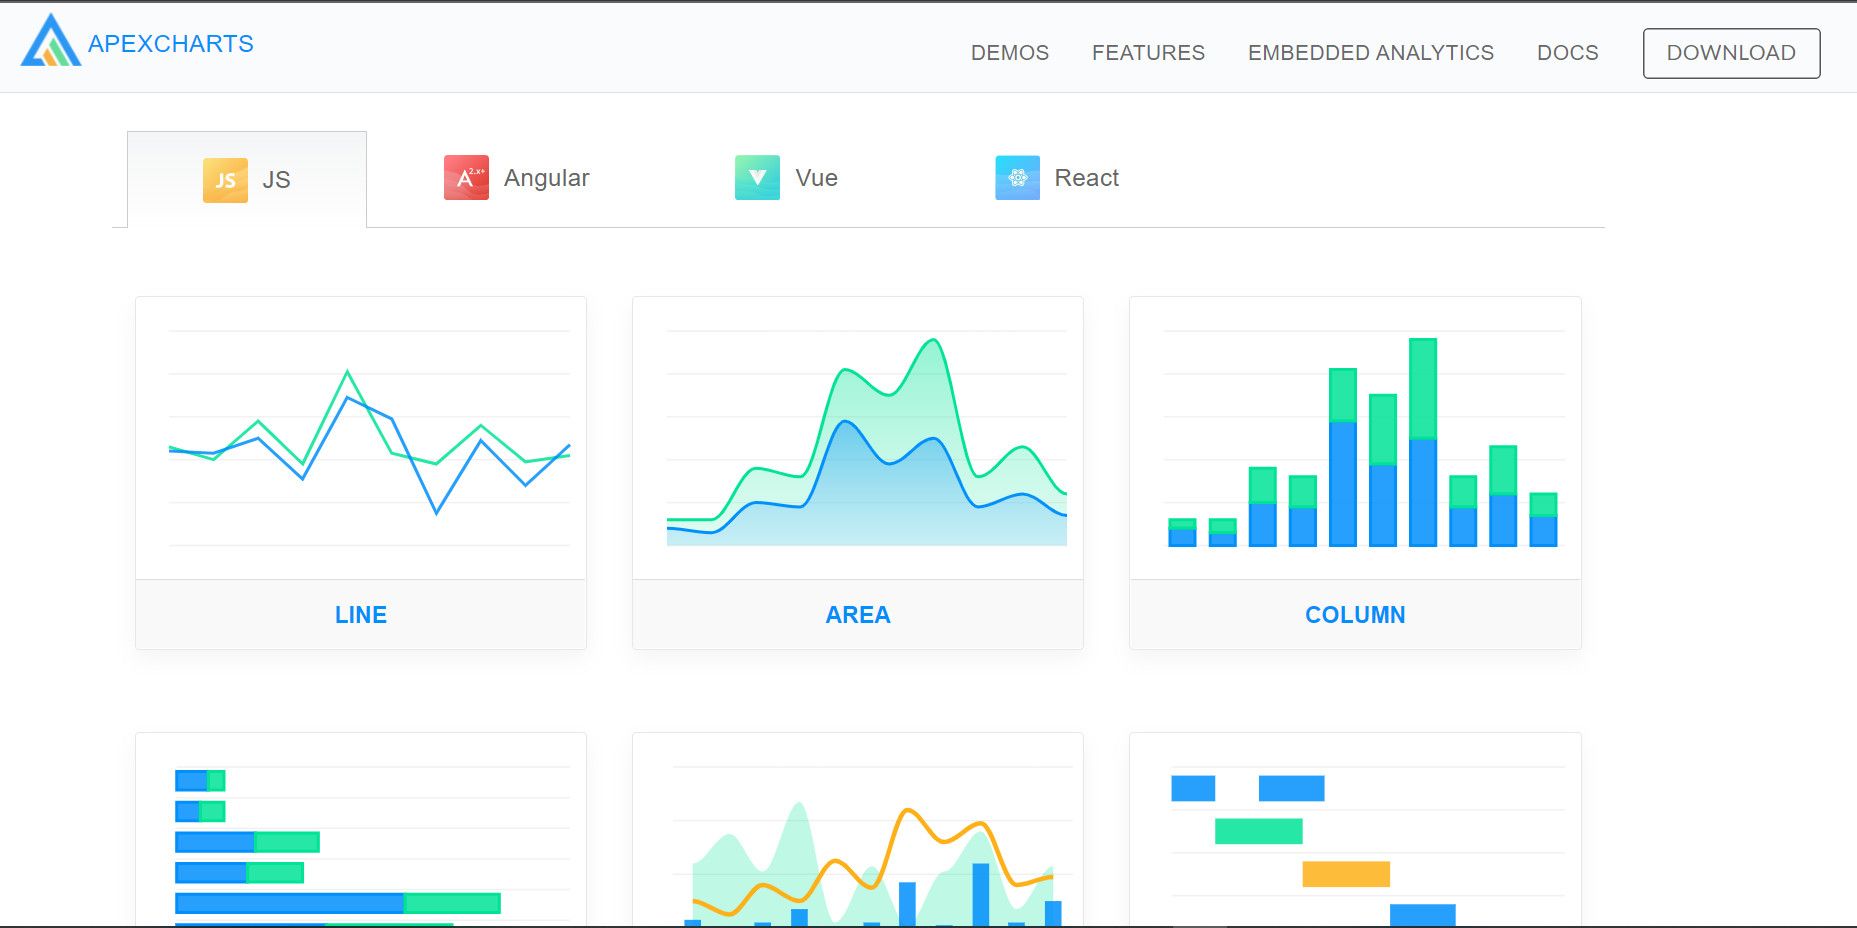
ApexCharts.js is an open-source JavaScript library for rendering responsive charts to the UI. You'll find it friendly to use, especially with its comprehensive documentation.
ApexCharts.js earned its reputation for featuring customization options that let you tweak your charts to adapt to various screen sizes without worrying about extra styling. It also supports many of the chart types used in day-to-day visualizations.
This library also works well with multiple charts. Combining different chart types in a single grid is one of its strong points.
7. Chartist.js
Chartist.js is an open-source project that emanates from the dissatisfaction of its contributing community in other JavaScript chart libraries. It uses the combination of inline SVG, CSS, and JavaScript to draw, style, configure, and finally render charts to the DOM.
This charting library also features different types of charts that many other libraries offer. Chartists.js wields strong support for CSS animation and responsiveness. Hence, its chart outputs adapt dynamically based on screen size.
Although the animation effects are unique, working with this library may be tricky for beginners. Nonetheless, you'll find the comprehensive and editable examples in the documentation helpful for any customization or animations you wish to add.
8. billboard.js
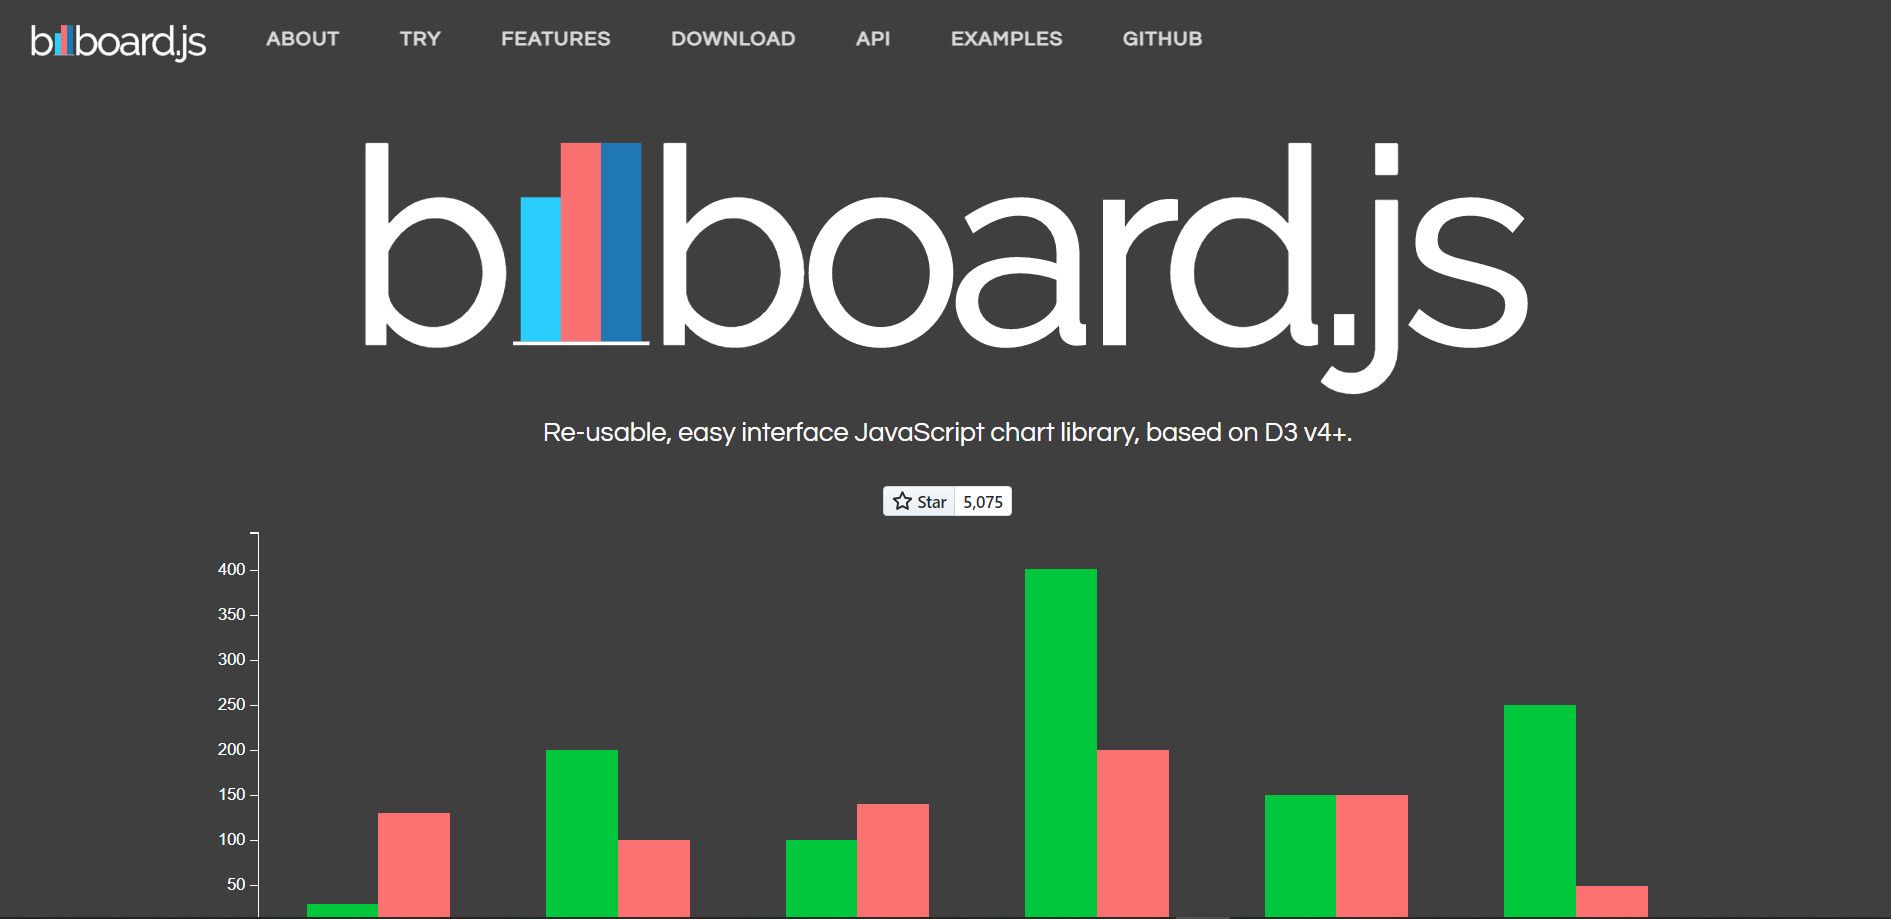
Whether you're working with a front-end JavaScript stack, TypeScript, or plain JavaScript, billboard.js is simple and worth using. It's a D3 v4-based JavaScript chart library.
The library supports 21 chart types and features comprehensive examples for each of them in its API docs. This makes it easy to learn and dependable for crafting visualizations quickly in your UI.
All of the code you need to make a chart with billboard.js sits in an object layer, and data insertion is easy since you can split data into separate arrays to draw as many graphs as you like.
Tell Stories on Your Website With JavaScript
Open-source tools make programming quick and easy in today's day and age. Chart presentation is one of the stages in your project where you can save ample time by using any of these existing JavaScript chart libraries.
Besides, they have the added benefit of making your app more modular and lightweight without making you wrap your head around writing extra scripts.
Plotting charts with JavaScript frameworks is the tip of the iceberg for the language of the web. There are countless projects out there waiting to be created. Happy hacking!


