No matter what your job is, getting away without using Excel is next to impossible. It's an excellent tool for businesses to streamline their data handling, and having a good grasp allows individuals to earn a living from it. Hence, it's imperative to improve grip over it.Whether you are a beginner planning to become a data analyst, an experienced Excel user looking to improve your data visualization skills, or a finance student trying to strengthen your command of financial modeling, you will find these courses helpful.
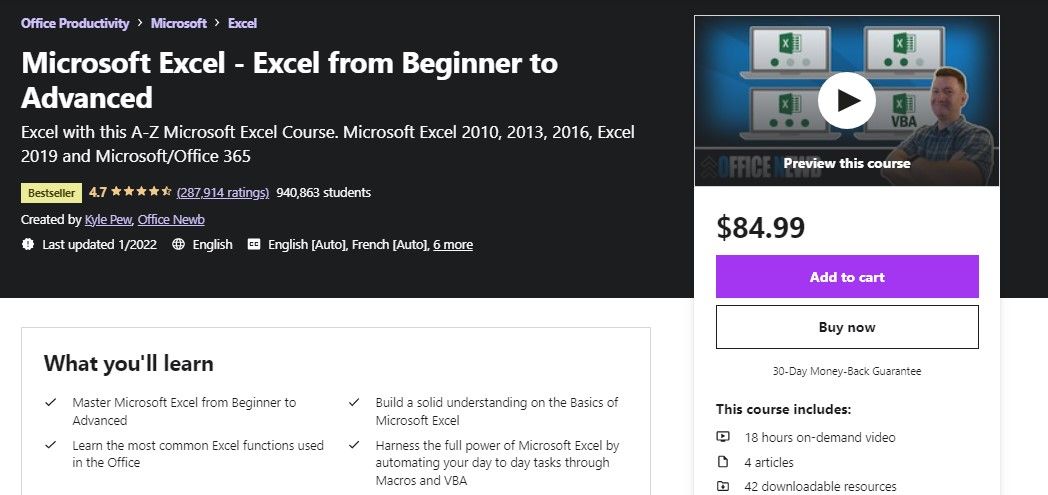
1. Microsoft Excel – Excel From Beginner to Advanced
All Excel users can benefit from this comprehensive course, regardless of their experience level. It is divided into four parts, starting with basic Excel concepts for beginners and ending with Excel VBA concepts for already competent Excel users who want to take their skills to another level. To get started, you will need a computer with Microsoft Excel installed.
In the first part of the course, the instructor introduces the Excel interface and demonstrates how to add, modify, and format data in the worksheet for those opening Excel for the first time. Following an introduction to handling data in Excel, you will learn how to create basic charts in Excel and make use of its templates.
In the second part that targets intermediate Excel users, the instructor teaches you how to work with Excel lists while learning some valuable formulas that help you manage the data in the lists. Then, following several lectures on data validation, importing and exporting, pivot tables, and using PowerPivot tools, the second part concludes with some practice exercises.
The third section takes the user's skills to the next level as it covers the basics of working with conditional, text-based, and Lookup functions. Next, the instructor will talk about Excel goal seek, solver, and similar tools, before giving you a brief overview of Excel macros.
The last part, mainly focused on Excel VBA, may not apply to larger audiences, but if you are already familiar with it, you'll find it helpful. Thus, if you have plenty of free time, 18 hours is all you need to become a competent Excel user.
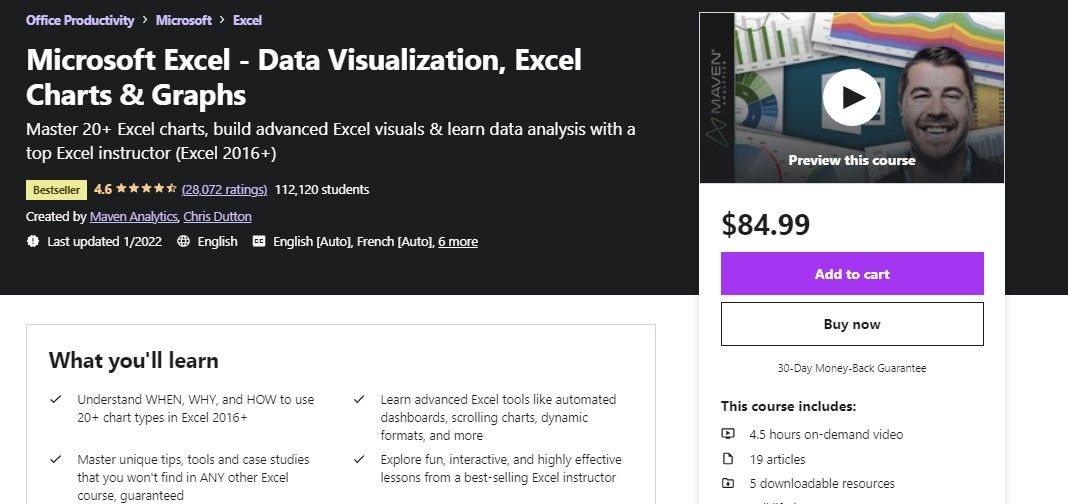
2. Microsoft Excel – Data Visualization, Excel Charts, and Graphs
Users of all experience levels are encouraged to take this course if they are eager to take their data visualization capabilities to the next level. You will need to have Microsoft Excel installed on your PC to begin.
The course commences with a few tips on data visualization and what elements make it good or bad. The purpose of this section is to clarify why data visualization is utterly essential. Following that is the chart formatting section, covering everything you need to know about using charts in Excel. It teaches you to create custom templates or use the pre-designed ones.
Next, the instructor explains how to visualize your data on more than 20 charts in Excel. Specifically targeting beginners, it covers basic bar, column, line, and area charts. Later, he moves on to scatter plots, bubble charts, whiskers, funnels, and radar charts for intermediate Excel users. This section concludes with a look at heat maps, combo charts, power maps, surface and contour charts, and Excel sparklines.
The last section of the course takes you to the practical side, where you will see how to create dynamic Excel dashboards and custom charts, and format charts conditionally. It combines theoretical and practical knowledge to enhance your charting skills over 4.5 hours.
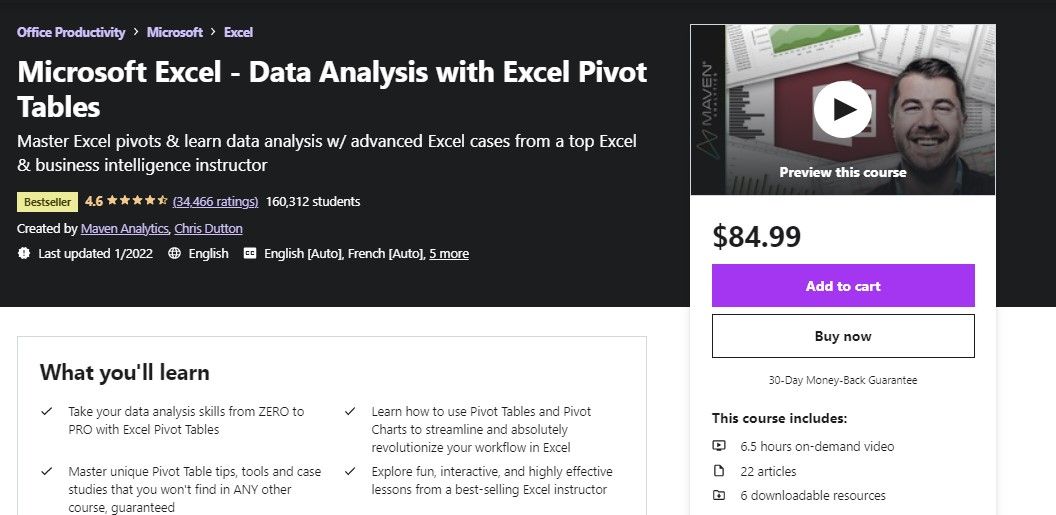
3. Microsoft Excel – Data Analysis With Excel Pivot Tables
This course is intended for intermediate Excel users familiar with Excel but have never used pivot tables before. It focuses on using Pivot tables effectively in Excel for data analysis.
The course begins with an introduction to pivot tables for complete beginners. Here, you'll learn what pivot tables are, how they help you visualize data better with different design options, and a few basic concepts about creating a pivot table—selecting, clearing, moving, and updating one that's already there.
The next two sections cover data formatting in pivot tables. The first one deals with formatting empty pivot table cells, customizing headers and labels, and introducing conditional formats. The second one explains how to sort pivot table data with different filters, group the existing data in the tables, and how both grouping and filtering work.
Following formatting comes the data handling part. Here, you'll learn everything you need to know about working with the data in pivot tables and how to use different functions and formulas to make your calculations. And then, you will learn to visualize the calculated data with pivot charts to enhance your data visualization skills.
Lastly, the instructor takes you through a series of case studies to show you how to apply pivot table concepts in real-world situations. Consequently, if you're not familiar with pivot tables or have some experience, taking this course will be enough for you to become a competent user.
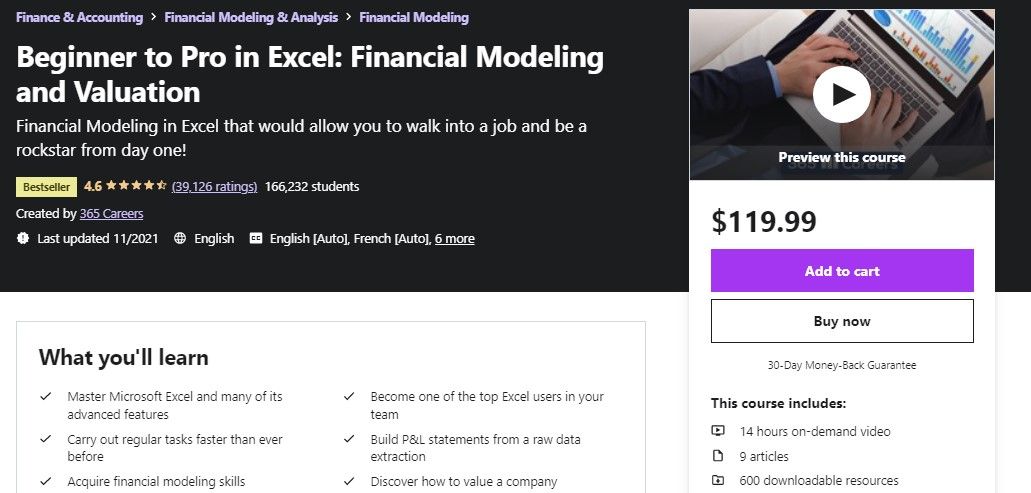
4. Beginner to Pro in Excel: Financial Modeling and Valuation
Those already in the finance field or planning to enter it will benefit from this course. It is a plus if you have some experience handling finances, but it does not matter if you are a complete beginner.
It starts with the basics of working with Excel—introduces basic concepts of handling data, and covers keyboard shortcuts to speed up navigation. Next, the instructor covers all the key Excel functions, from IF to Goal Seek, with a brief glimpse at pivot tables.
The next part of the course will teach you how to apply financial functions to real-world data through examples such as preparing loan schedules and calculating ROI. The instructor gives a brief overview of pivot tables without going into too much detail. Then, he creates a profit and loss statement from scratch, and in doing so, he applies everything you've learned so far to demonstrate the practical side of your learning.
After briefly discussing Excel charts, the instructor visualizes the same profit and loss statement using Excel charts to illustrate their significance. Afterward, the instructor introduces different types of financial analysis and includes financial modeling fundamentals.
A brief explanation of how business valuation, acquisition, and mergers work will follow and how to build discounted cash flow models with different balance sheets is also discussed. This section shows you how to apply fundamental concepts to real-world situations.
Lastly, after covering case studies and practical valuations of multinational companies like Tesla, the course concludes by showing how the concepts you learn will benefit your career as a financial analyst.
Which Udemy Course Should You Take?
While the first course will teach you basic concepts, the second one will take your data visualization skills to the next level. Similarly, the third course will help you understand pivot tables better, while the last one will make you a better finance expert. Consider taking them all if you have the time and money to invest.
Would you like to master advanced Excel skills? Then, check out some other courses covering advanced Excel concepts such as data visualization, data analysis for decision-making, learning Excel macros and VBA, and much more.


