Creating and running a website is a fun and challenging hobby—especially if you host it on a Linux system, using your own hardware or a VPS. But measuring visitor traffic and analyzing behavior can be difficult if you don't want to rely on intrusive third-party analytics packages.
GoAccess gathers data from your server logs and provides a beautiful terminal user interface where you can discover what visitors want from your site, and how to improve it.
Why Not Use Google Analytics?

Google Analytics is the de-facto king of analytics packages, and most of the sites you will visit today (including this one) will record basic facts about your visit, including your IP address, browser, operating system, and more.
Your progress around these sites will be tracked using cookies. The advantages of Google Analytics for website owners are obvious. It's easy to start with, free to use, and powerful.
You can deploy Google Analytics on almost any webpage by copying a code snippet into the header of your pages, using plugins, or following our instructions to add Google Analytics to your WordPress site.
But Google doesn't have the best reputation as a respecter of privacy, and if people are visiting your website from other countries, you may have concerns that using Google Analytics will land you in hot water with the various data protection agencies.
Plus, if you're running a website on your own hardware in your own home, Google Analytics can just feel a little... icky.
GoAccess Leverages Your Access Logs to Provide Great Analytics
Aside from sharing the same initialization and similar functionality as Google's offering, GoAccess couldn't be more different in how it works.
When you run a Linux server, either on a physical machine or a VPS, it's standard practice to log all visits in access logs. These logs record all the information offered up by your visitor's browser—typically including device type, IP address, operating system, and browser, alongside the page they are viewing and the time.
Looking through these logs can give you some insight into who is visiting your site, what they're looking at, and more. But access logs aren't especially easy to read, and counting every single entry is time-consuming and tedious.
GoAccess takes the information in your logs and formats it in a way that's intuitive and easy to read, with graphs and charts, displaying various metrics including visitors per day, requested files, time distribution, static resources, country of origin, status codes, and more.
It's not privacy invading, doesn't send user data out of the country, and doesn't require you to incorporate Google's code.
Install GoAccess on Your Linux Server
GoAccess is available in the standard repositories for most distros. To install GoAccess on Debian or Ubuntu:
sudo apt install goaccess
On Arch and related distros:
pacman -S goaccess
Or for Fedora:
yum install goaccess
If Gentoo is your distro of choice:
emerge net-analyzer/goaccess
You'll need to tell GoAccess exactly how your log files are formatted. Use nano to edit the GoAccess config file:
sudo /etc/goaccess/goaccess.conf
Everything in this file is commented out, and you will need to uncomment lines that correspond with the time format, date format, and log format. You can check one of your system logs to discover whether they write the date format as %d/%b/%Y or %Y-%m-%d.
Save and exit nano with Ctrl + O then Ctrl + X.
Use GoAccess to View Your Website Analytics in the Terminal
Using GoAccess to view your logs is easy: simply feed the path to your log or logs to GoAccess. Apache logs are usually stored in /var/log/apache2/, while NGINX logs are in /var/log/nginx/. For instance, running:
goaccess /var/log/apache2/your_site.log

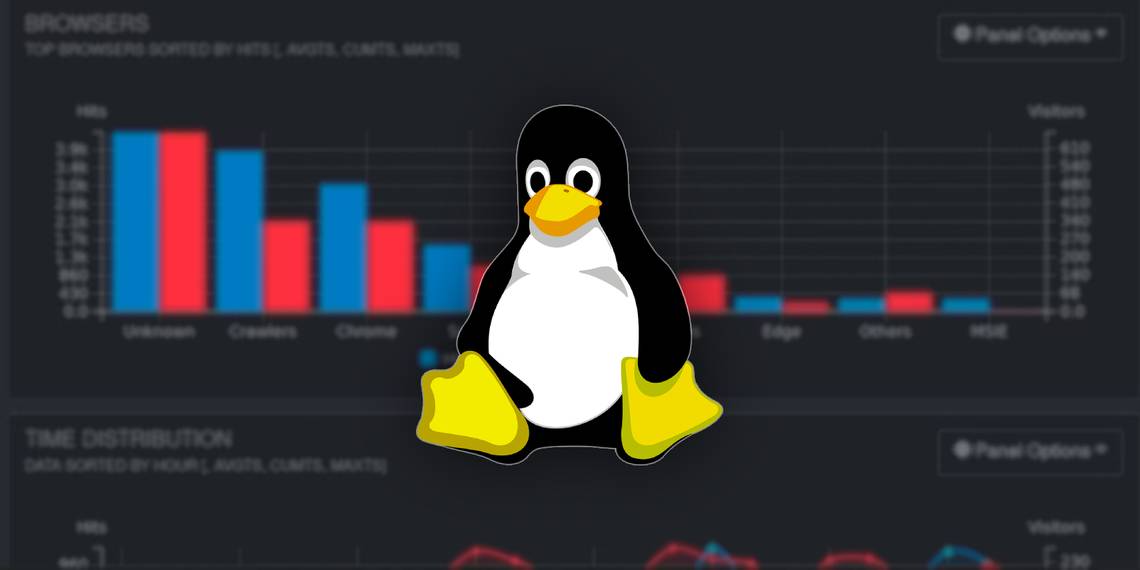
...will produce output similar to the above image.
You can see that the fields displayed include:
- Overall Analyzed Requests: This section gives a breakdown of total requests, unique visitors, requested files, referrers, and more.
- Unique Visitors Per Day (including spiders): This section shows you a bar chart of visitors per day.
- Requested Files (URLs): Gives a list of the seven most visited URLs, together with the total bandwidth for each, the total number of hits, and the percentage of traffic.
- Static Requests: These are requests for files that are not HTML. Usually CSS or images.
- Not Found URLs (404s): Shows the URLs which have been requested, but not found. Unless your site is configured poorly, these are likely to be bots trying for commonly used targets such as login, settings, or config pages.
- Visitor Hostnames and IPs: Shows the IP addresses of the seven most frequent visitors. If a hostname is available, it will show this, too. These are likely to belong to RSS feed readers.
- Operating Systems: This shows you the most common operating systems of users visiting your site.
- Browsers: The most common browsers visiting your site.
- Referring Sites: Where visitors came from to get to a particular page.
Analyzing a single log file is fun, but analyzing multiple files simultaneously gives you a view of your site's performance over time. Feed in your entire log directory with:
goaccess /path/to/logs/*
Or selectively parse multiple log files with:
goaccess your-site.log your-site.log.1 your-site.log.2
View GoAccess Analytics in Your Browser

While viewing log file analytics in your terminal is the coolest way of doing anything, some people prefer to use browsers to view statistics.
GoAccess can generate and update an HTML file in real-time with:
goaccess /path/to/log/file.log -o /path/to/report.html --real-time-html
You can then open report.html in your browser.
If you want to be able to access your GoAccess report through a web address, write the report to the HTML directory of your website.
If you're not running GoAccess as the root user, or if your user doesn't have write permissions for the HTML directory, use sudo. For instance:
goaccess /path/to/log/file.log -o /var/www/your-site-root-directory/report.html --real-time-html
You can then access the report from any machine at https://your-site.tld/report.html.
As you'd expect, the report is much prettier than it appears in the terminal, although it contains the same information, and you can click on elements. To change from the default theme, click the cog on the left side of the screen, then select dark gray, bright, dark blue, and dark purple.
You can also choose the number of items per page and the number of layouts.
GoAccess Isn't the Only Privacy-Friendly Alternative to Google Analytics
Running GoAccess on your Linux server is simple, and means that you don't need to leave the comfort of your terminal if you don't want to.
If you like to view your site analytics in your browser, Google Analytics isn't your only choice. There are several great privacy-friendly alternatives to Google Analytics.