Do you diagram to develop ideas and plan? If not, you should! Diagramming makes your ideas more solid because they start to exist in the real world, outside of your mind.
Thinkers out there have also developed visual models you can follow to help you plan and make decisions. We'll introduce you to five models and diagramming methods that you may not know, and tips and tools to help you make the most of them.
Personal Performance Model
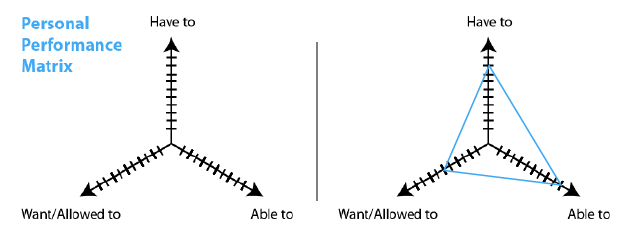
The Personal Performance Model (developed by Mikael Krogerus and Roman Tschäppeler, authors of The Decision Book: 50 Models for Strategic Thinking) helps you decide whether you should change your job by tracking your satisfaction (or dissatisfaction) numerically.
How It Works
You may want to do this in a notebook where you can draw out the model on the pages and flip between them. Alternatively, you could make a line-graph of your answers to track them over time
Every evening for three weeks, ask yourself the following three questions, and insert your answers in the model on a scale of one ('doesn't apply at all') to ten ('totally applies').
- Have to. To what extent are my current tasks being imposed on me or demanded of me?
- Able to. To what extent do my tasks match my abilities?
- Want to. To what extent does my current task correspond to what I really want?
-- The Decision Book: 50 Models for Strategic Thinking
On a three-pointed plane, you'll see that your answers form a "sail". If your answers change significantly, then the sail is changing, and at least it shows you have variety in your work. The bad days may be only occasional.
If your answers stay roughly the same day-to-day (the sail doesn't change), ask yourself how satisfied you are with that state. Are you getting what you want out of your job? What would you rather, and do you have the means to take the leap?
You might need this diagram when assessing a job offer in case you're looking for a new career. While there are many apps which can help you make decisions, an analog skill with a simple diagram like this could be a more powerful exercise.
The Eisenhower Matrix
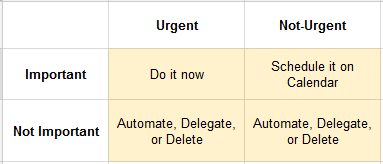
The Eisenhower Matrix (developed by former US President Dwight D. Eisenhower) helps you prioritize your tasks and work more efficiently. It's also a good model for people to follow to decide what to handle themselves and what to delegate, delete, seek help with, or automate.
How It Works
Each of the tasks on your to-do list need to be assigned a quadrant according to which ones are 1) Important and Urgent, 2) Important but Not Urgent, 3) Unimportant and Not Urgent, 4) Unimportant, but Urgent. Then, simply follow the model as shown above to decide what to do when.
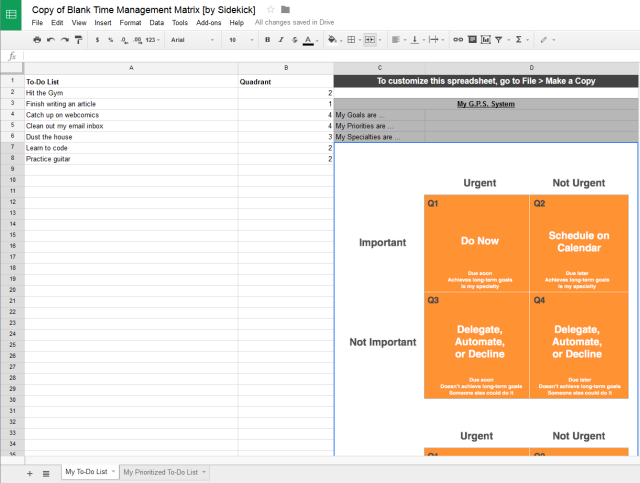
You can automate the Eisenhower Matrix with this Google Sheet template by Sidekick. After you open it, go to File > Make a Copy, and you'll have your own version to fill in. As you fill in the list, your to-do items will be automatically sorted on the spreadsheet page labeled "My Prioritized To-Do List".
Obviously you have to do the Q1 items first, but the key to living a great life (or planning a great event) is to figure out when you will do the Q2 items. The items in Q2 make us better. They let us "level up".
If you have always wanted to learn to play guitar, you need to put it in Q2, and the rule for Q2 is that you need to schedule it. If it's important, it needs some time in your schedule, whether that's tomorrow or months down the road. Just because you have no pressing need to learn guitar right away, doesn't mean you keep putting it off forever.
Check out our productivity tip on how to prioritize better.
Gantt Charts
Gantt charts (created by Karol Adamiecki and independently by Henry Gantt) help you manage the phases of complex projects over time by visually showing what tasks need to be completed on a horizontal time scale. Here's a video with some history and tips from projectmanager.com:
How It Works
To start your Gantt chart simply, try a tool like Smartsheet. Put down your big tasks, and break them down into smaller tasks. Enter the date that each task is to be started and finished, or use your mouse to click and drag on the end points of the subtasks.
Let's say you were planning a wedding.
A big task might be "Organize decorations". That could be split into sub-tasks such as choosing flowers, buying chair covers, and selecting table centerpieces. "Building a guest list" could be a big task including brainstorming attendees, organizing a seating plan, and distributing invitations. Some of these tasks can be done by different people, and some of them have to be done before others, so you can plot all the tasks on your Gantt chart to make sure everyone involved in the planning stays on track and gets done on time.
You can also check out Binfire's product management tool with Gantt Charts for an alternative.
Affinity Diagrams
An affinity diagram helps you brainstorm by building connections between different concepts. It's a great form of brainstorming for a group.
Unlike traditional group brainstorming, you don't have some people yelling out ideas while others quietly think --"That's a stupid idea," all the while you try to scribble them down on a whiteboard.
How It Works
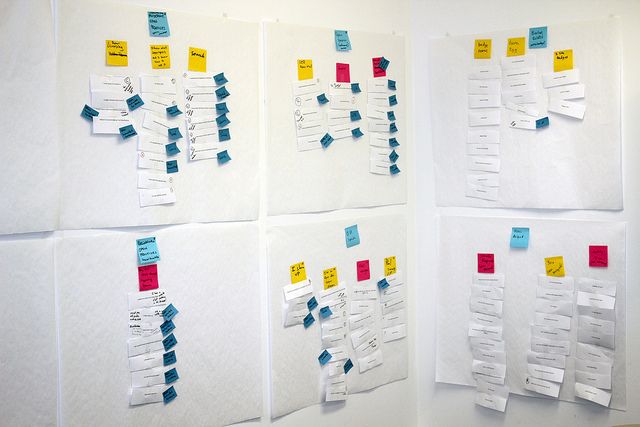
You start affinity diagramming by collecting ideas on sticky notes or Post-Its. Give everyone a stack of sticky notes and a pen, so they can all write their ideas down at once. Give them a prompt, like, "things you love about our brand" "things our team could work on" or "features of our competitors' product". Instruct the group to put down one idea per Post-It, and use as many as they like. Use a different color for each question.
After a few minutes of working on each question, put the sticky notes up for everyone to see. Now, you can go through the answers together. You will see common themes emerge among the ideas. Let your group start to move them around and talk about clustering them by what feels right, and what fits the spirit of what the original writer meant.
After everyone seems happy with the clusters of ideas, give each cluster a name. Now you have big themes and concepts for your project that help your team get on the same page, and reveal what's important to the group. Finally, photograph the board.
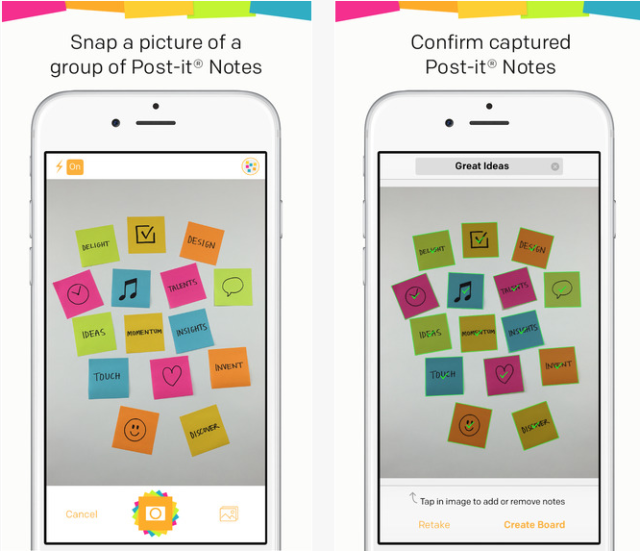
If someone in the group has an iPhone, you can use the Post-It Plus app to capture the post-its, move them around, and share with the group.
Mind Maps
Mind maps help you study and build creative ideas by organizing thoughts visually around a concept. It's a little like the opposite process from Affinity Diagramming.
How It Works
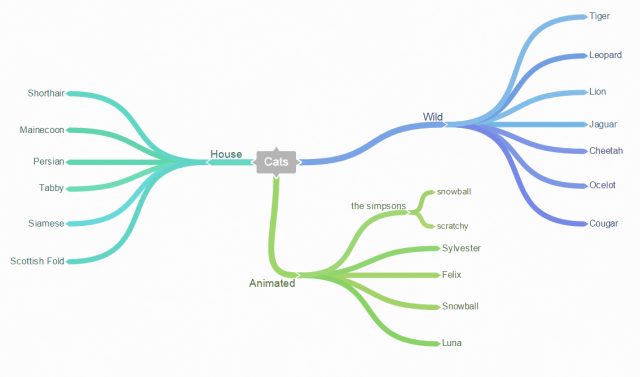
Start by putting the name of your concept in the center of the page, and circle it (like the Cats mindmap I started above in Coggle). As you're thinking (or paying attention in a classroom or lecture), add branches to that concept and connect it with the big ideas that contribute to it. Branch those concepts off into smaller ideas and notes, and so on and so forth. Use different colors, shapes, and connecting lines as necessary -- or draw illustrations if they help you capture an idea.
When you're done, you'll have a web connecting ideas and concepts together. When you look back on it later, studying will be easy because the concepts won't be displayed linearly, but by how they relate to each other.
If you're mind-mapping to brainstorm, try to approach it from the angle of filling out each of the branches as much as you can. It will help you get past a creative block because if you don't know what to think about next, or what kind of project you should make, you can look to your mind map and ask yourself, "What areas could I stand to fill out more?"
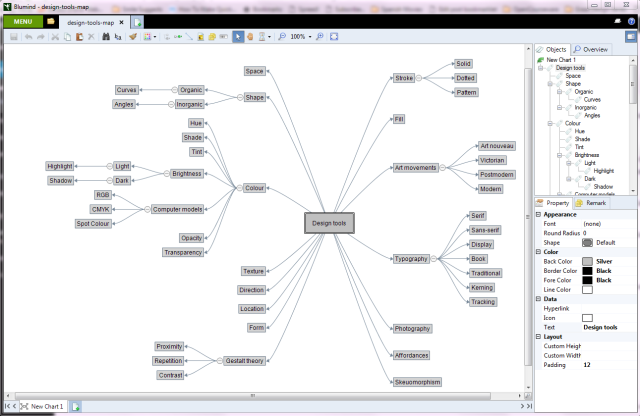
One of my favorite tools for mind mapping is Blumind, for Windows. It's lightweight, has great keyboard shortcuts, and lets you instantly transform your mind map into a variety of different formats like hierarchical organization charts, tree diagrams, and logic diagrams. There are mind-mapping tools for other platforms out there too.
What Kinds of Diagrams Do You Use?
There are tons of useful models and diagrams that you can make to solve everyday problems.
What kinds of diagrams do you find yourself using a lot? Let us know what we missed. We'd also love to hear about the kinds of tricky problems you may have had to solve and how you did it -- or challenges that may seem so complicated to plan that you don't know where to begin.
Image Credits: Badges Affinity Diagram by Open Michigan via Flickr

