When things go wrong with Linux, it can be a nightmare to troubleshoot. The inherent challenges associated with this are doubled when the problem you're facing is intermittent, and you don't know what's causing it.
I suppose you could spend hour after hour perusing Stack Overflow, and asking Reddit for help. Or you could take things into your own hands, and dive into your system's log files, with the aim of finding out what the problem is.
What Are Log Files?
Many programs -- be they for Windows, Mac, or Linux -- generate log files as they go. Even Android generates them. These are plain-text files that contain information about how a program is running. Each event will be on its own line, time-stamped to the second.
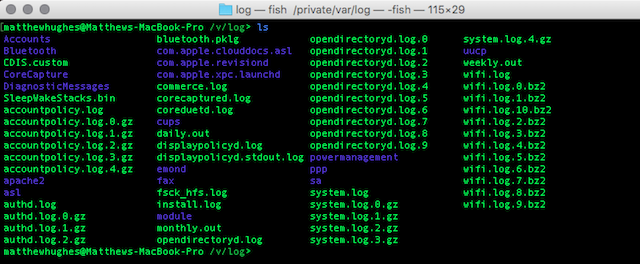
Although this isn't universally true for all applications, log files typically tend to be found in the /var/log directory.
Overwhelmingly, the data in these files will be mundane. It won't necessarily be indicative of a problem. It'll just be updates on what the program was doing at a given time.
But when there is a problem, you can guarantee that information about it will be contained in the log files. This information can be used to remedy it, or to ask a descriptive question of someone who might know.
So, when dealing with log files, how do you isolate the information you care about from the stuff you don't?
Using Standard Linux Utilities
Like we mentioned before, log files aren't exclusive to any one platform. Despite that, the focus of this article is going to be Linux and OS X, because these two operating systems ship with the essential UNIX command line tools required to parse through them.
Since log files are plain-text files, you can use any tools that you'd use to view such files. Of these, grep is probably the most difficult to learn, but also the most useful. It allows you to search for specific phrases and terms within a particular file. The syntax for this is grep [term] [filename].
At their most advanced, you can use regular expressions (RegEx) to search for terms and items with a laser-focus. Although RegEx often looks like wizardry, it's actually pretty simple to get the hang of.
Then there are the 'head' and 'tail' commands. No points for guessing what these do. They show you the top and bottom ten lines of a file, respectively. So, if you wanted to see the latest items on a logfile, you'd run "tail filename".
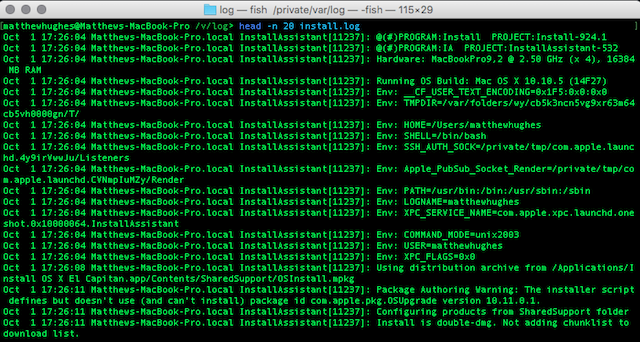
You can change the number of lines displayed by using the '-n' trigger. So, if you wanted to see the first 20 lines of a file, you'd run
head -n 20 [filename]
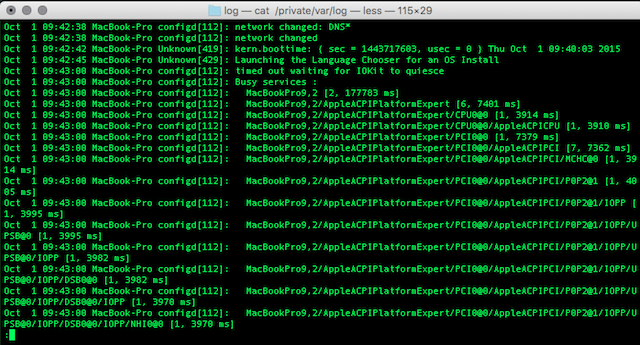
If you want to look at the entire contents of a file, you can use the 'cat' utility. This can be a bit unwieldy though, as log files can often measure in the hundreds of thousands of lines. A better idea would be to pipe it to the less utility, which will let you view it one page at a time. To do that, run
cat [filename] | less
Alternatively, you could use sed and awk. These two utilities allow you to write simple scripts which process text files. We wrote about them last year.
Finally, if you're confident with it, you might also want to try the vim text editor. This has a bunch of built-in commands that make it trivial to parse through log files. The 32-bit version of vim also has a maximum file size of 2 GB, although I wouldn't recommend you use it on files that large for performance reasons.
Using Log Management Software
If that sounds like too much hard work, or you fancy using something more visual, you might want to consider using a log management application (often confused with SIEM, or Security Information and Event Management).
What's great about these is that they do much of the hard work for you. Many of them can look at logs, and identify issues automatically. They can also visualize logs in all sorts of pleasing graphs and charts, allowing you to get a better understanding of how reliably an application is performing.
One of the best known log management programs is called Splunk. This log management tool lets you traverse files using a web interface. It even has its own powerful and versatile search processing language, which allows you to drill down on results in a programmatic manner.
Splunk is used by countless large businesses. It's available for Mac, Windows, and Linux. But it also has a free version, which can be used by home and small-business users to manage their logs.
This version -- called Splunk Light -- shares much in common with the enterprise versions. It can browse logs, monitor files for problems, and issue alerts when something is awry.
Having said that, Splunk Light does have some limitations, which are pretty reasonable. Firstly, the amount of data it can consume is limited to 500 MB a day. If that's not enough, you can upgrade to the paid version of Splunk Light, which can consume 20 GB of logs per day. Realistically though, most users won't get anywhere near that.
It also only supports five users, which shouldn't be a problem for most people, especially if it's only being run on household web and file servers.
Splunk offers a cloud version, which is ideal for those not wishing to install the whole client on their machines, or those with a number of remote servers. The downside to this is the massive cost involved. The cheapest Splunk plan costs $125.00 per month. #
That's a lot of cash.
How Do You Handle Your Log Files?
So, we've looked at ways you can interrogate your log files and find the information you need to troubleshoot, either in person, or with remote assistance. But do you know of any better methods? Do you use a log management software, or the standard Linux utilities?
I want to hear about it. Let me know in the comments below.


