Recently, I was working on a story involving a person that made a phone call, which was recorded. That person later refused to admit that they'd ever made the call at all.
With the recorded voice from the phone call and a clip of the person denying the accusation, I set to work trying to find a way to prove that the voices were one and the same.
I admit that I'm a bit obsessed with voice technologies. This is why I've been waiting for Google Voice to become more advanced with its voice recognition technology, and it's why I love PC voice control apps like Tazti. However, when it comes to digitally comparing voices, I was at a loss. You've probably seen those spy movies where the computer can automatically identify the voice of a known criminal with the voice print alone.
To be honest, once I discovered Sonogram Visible Speech, I realized that spectrogram voice technology actually is currently a viable way to solidly identify a person by their voice alone.
Understanding Spectrogram
If you know about chemical isotopes, then you know that with isotopes, chemists can identify the chemical makeup of compounds by isolating the basic elements and using the breakdown to identify the individual components of any mixture. In much the same way, an audio spectrogram breaks down audio sound into basic frequencies. The interesting thing about the human voice is that no one speaks in one frequency. Your mouth, nasal passages and the structure of your voice box determines the mixture of frequencies that make up your somewhat unique voice.
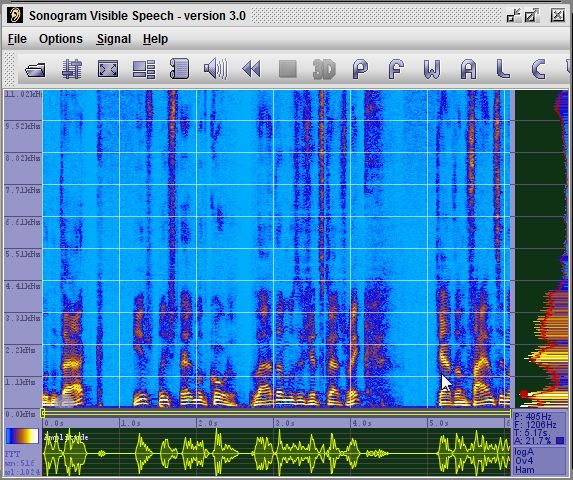
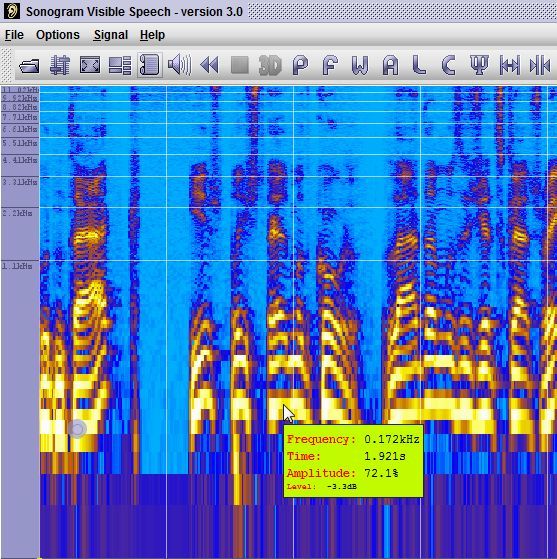
Sonogram Visible Speech is a free spectrogram software application that will take video or audio files and break down the audio track into the entire spectrum - all of its frequencies throughout the entire time frame of the track. A completed spectrogram looks like the image below.
As you can see, the bottom track looks like the basic sound wave that you'd see in a program like Audacity, however the center pane displays each segment of the sound file in its entire frequency layout. The amazing thing about this software is that there are many other waveforms you can use to examine your sound file. These are especially for advanced users.
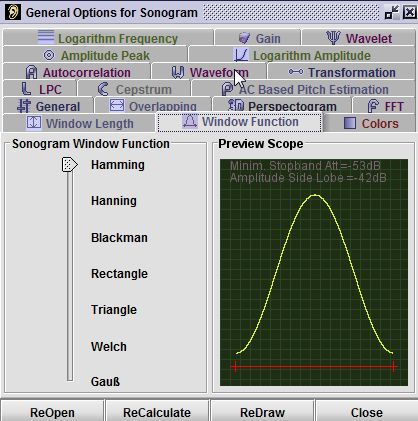
You can configure how each of those wave forms displays by going into the the "Options" menu, and selecting "General Adjustment." Here you can define how the logarithmic graphs calculate output and the general display setup of all available charts.
If the sound is fairly quiet, or the voice you're analyzing is a whisper, you may want to consider using the logarithmic frequency display. You enable it from the "Options" menu and select "Logarithmic Frequency." This will somewhat "magnify" the significant areas of frequency in the spectrogram.
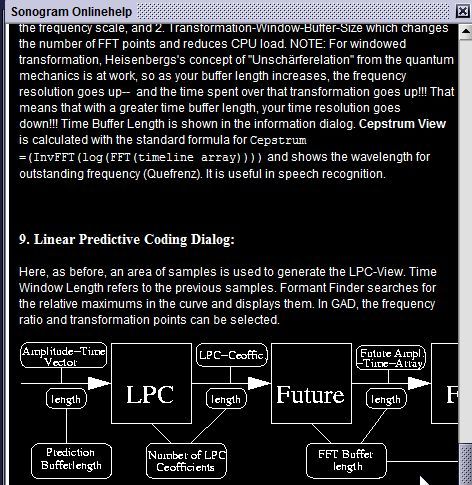
This can really help to identify clear frequency patterns that identify someone from the sound of their voice. If you're completely lost, and you don't know where to start, clicking on "Help" and going to "Online Help" will open up the very well written Sonogram Online Help manual. This is a great place to start if you're new to spectrogram audio analysis.
An Experiment With Spectrograms Using Ghost Hunting
The beauty of this software is that it is good for many different uses. One of the artifacts that comes up often in ghost hunting, a personal interest of mine, is "electronic voice phenomenon" - where the voice of an apparition or ghost allegedly shows up on audio recordings. These recordings are scattered throughout the web, so I decided to pull a few off of the ghost hunter websites and do a spectrogram analysis.
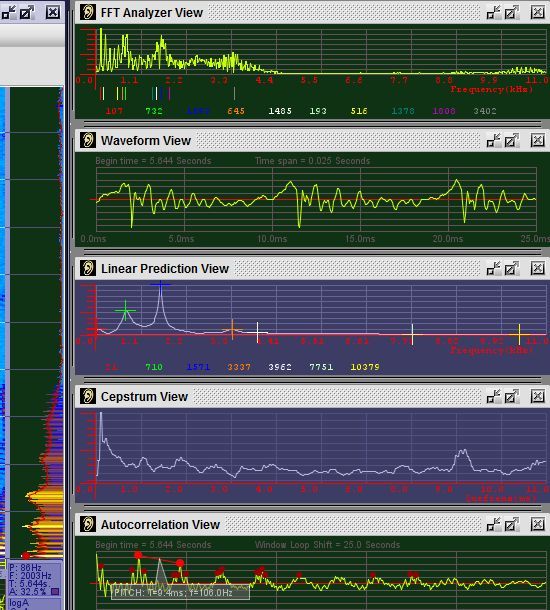
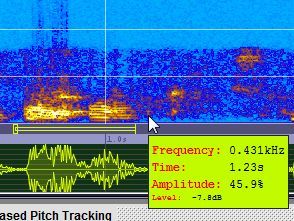
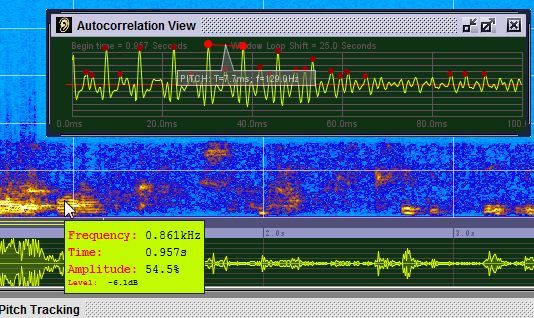
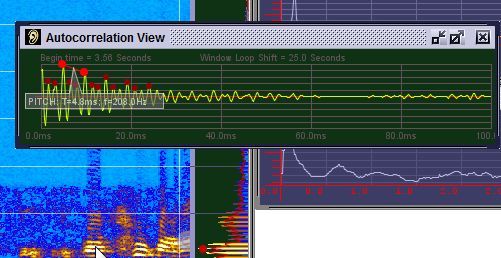
The spectrogram shows that the frequencies of the voice are generally low, but to get a better picture of the voices in the recording, you need to open up the additional waveforms. The Autocorrelation View calculates "pitch" in the time frame where you hover the mouse.
The "ghost" has an average pitch frequency of about 129.0 hz. Scrolling to the end of the recording where you hear the investigator's voice, the calculated pitch frequency is about 208.0 hz (which makes sense because it's a female voice and the ghost recording sounds male.)
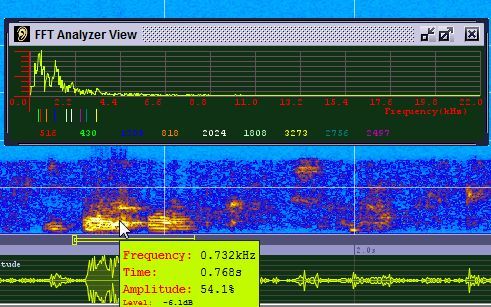
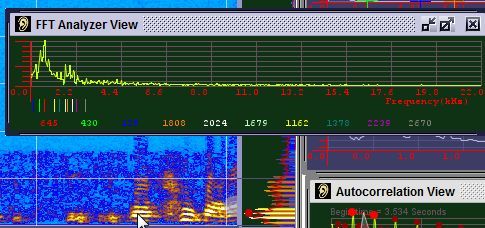
Opening up the Fast Fourier display reveals even more detail about the voices. This chart quickly breaks down the primary frequencies and displays them in a color code.
In this case, the breakdown of frequencies is spread apart, with some high, but a good number of low frequencies in the mix as well. However, the investigator in the room is clearly speaking in a voice that is clustered in frequency more toward the high end of the range, as shown here.
This quick analysis proved that the two voices are quite different, but this is only a basic example of the capabilities of this powerful software. Basically, any situation where a breakdown of frequencies of a sound wave can help - this is the software for you. It's easy to learn, quick to set up and configure, and it performs as well or better than any paid spectrogram software on the market.
Do you have any projects that could use a spectrogram? Have you ever tried Sonogram Visible Speech? Share your insight in the comments section below.

