If you've been following my jQuery tutorials so far, you may have already run into some code problems and not known how to fix them. When faced with a non-functional bit of code, it's very difficult to actually pinpoint the offending line of code - and that's where debugging and developer tools come in.
So before continuing with some more complex jQuery code, I thought we'd examine the tools available in the world's most popular browser - Chrome. These tools aren't just for Javascript though - they can also help you debug any AJAX requests, resources your site needs to load, examine the DOM structure, and a whole bunch of other things.
No Love For Firefox?
Although I'm specifically going to refer to the Chrome developer tools today out of personal preference, and the fact that they're built into the browser, the same functionality is available in a plugin for Firefox called Firebug - the interface is nearly identical, so this guide should still apply.
Launching The Debug Tools
This couldn't be easier. In Chrome, simply hit CTRL-SHIFT-I (CMD-ALT-I on Mac) or right click anywhere and select Inspect Element. You should see something similar to the following:

There is a slight difference to these two methods of launching the debug console. The shortcut key will simply open it up in a default view, while Inspect Element will focus the DOM tree onto the specific element that you right-clicked on. Which brings us onto the first awesome bit of functionality we get from these tools.
Elements & CSS
The Elements tab is divided into two sections; on the left is the complete DOM tree. This is similar to the source code of the page, but is distinctly more useful.
For a start, it's been parsed into a tree structure, so elements can be collapsed and expanded, allowing you to examine child elements, parents and siblings more obviously than just reading source code. Secondly, it reflects any dynamic changes in the page resulting from Javascript. For instance, if your jQuery was supposed to be adding a class to certain elements on pageLoad, you would see that reflected in the DOM tree, but not the page source.
You can also edit the DOM right there, by simply double-clicking on it. Yes, you can use this to play around and edit websites to make silly screenshots, so it's great for simple experimenting.
Here's me messing with the BBC news homepage...

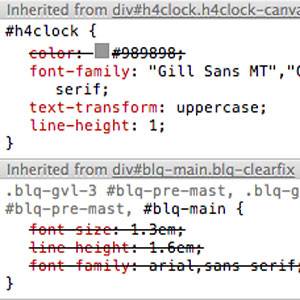
On the right hand side you can view any CSS rules applied to current element, including which have been overridden by higher order rules (these have a line through them):

You can adjust these, or just un-tick a particular rule to see what would happen.
Unrolling the "computed styles" will show you a summary of every CSS rule currently being applied. The line number and file link to the far right will jump you straight to the resource file it's been loaded from, although in some cases it may be a minimised file (so everything is on one line).
Bear in mind that none of the changes you make here will be saved, so the next time you refresh the page it will be back to normal. If you're playing with the CSS, be sure to note down exactly what you've changed when you get the desired result.
Error Console
The second most important tab as far as my daily usage of these fantastic tools go, is the error and debug console, the last tab in the list. For a start, any Javascript errors are going to be shown here. When you're first starting out with jQuery, you might find a few instances of "$ is undefined" or "jQuery is undefined" - a common error that means you've forgotten to a link to jQuery in the header. If you see an error which you can't decipher, just copy it into a Google search box and you'll more than likely find lots of other people who had the same problem.

The error will also point to the exact line of code in which the error first occurred; click on this to jump straight to that line and section of code. If this is in one of your own scripts, it can often pinpoint you straight to the offender - if the error is more vague though, it may point to the jQuery source code which is completely un-readable.

Suffice to say, the console is the first thing you should check when something doesn't work right, as it's more than likely printed out an error there.
The other use for the console is to output your own custom debug statements. You can either send a bit of text, such as letting yourself know the script has reached a certain point:
console.log("got to this bit in the code ok, now trying to ...");
Or you can output entire objects and variables as simple as:
console.log(myVar);
Try now by using some basic jQuery to select some elements, then output them to see what they look like. You can use this to check what your selectors have found, for example.
Network
The final tool in the developer toolset I wanted to show you today is the Network tab. In order for this tab to function, you need to be focused on it and refresh the page - it'll then capture any requests that the page makes, for advertising, Javascript, CSS, images - everything - and give you a breakdown of information about that interaction, including:
- filename.
- type of request (GET or POST).
- response code the server sent back (200 OK, 304 Not modified etc).
- filesize.
- timing.

Clicking on an individual file will bring up some even more detailed information about the interaction between your browser and the server. For me, this is particularly useful when debugging AJAX requests - you can see exactly what kind of data was sent with the request, and the full output of the response given by the receiving server-side script.

Summary
I hope that I've armed budding developers with some additional tools. If you found this post useful, I would really appreciate a share, because it makes me feel all warm and fuzzy inside, and tells me you want me to write more like it. I also welcome comments and feedback - particularly, what other tools do you use as a web developer? Do you have an arsenal of Firefox plugins at your disposal?