In his book Work the System, Sam Carpenter coined the term "Biological Prime Time". This bombastic term means little more than "your most productive, focused time of day".
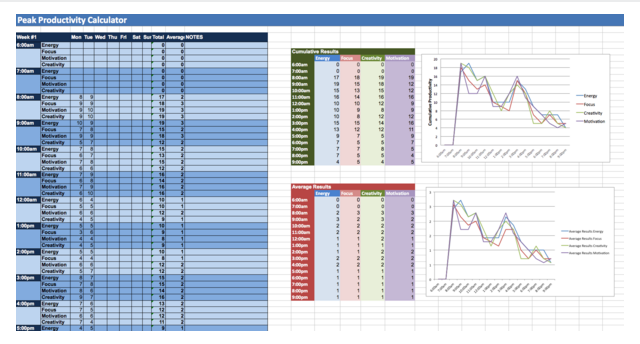
In this article you'll be given an incredibly simple Excel spreadsheet to help you calculate your own "Biological Prime Time". This will help you to understand when you work best, so you can structure your day efficiently around these periods of productive time.
Understanding Your Prime Time
Each one of us has an ultradian rhythm. This is a recurrent cycle that our bodies go through each day. This pattern was first noticed by sleep researcher Nathaniel Kleitman, which caused a mountain of research to be conducted in this area.
The results of this research clearly show that the human body goes through cycles of between 90 and 120 minutes. Through each of these cycles we are taken from an unproductive trough, to a productive peak, and then back again.
This much we can take as true. But from personal experience, it's obvious that these peaks and troughs are far from equal.
Some troughs leave us prone to distraction and procrastination. Others leave us aching for bed. On the other hand, some peaks see us happy to work through a few emails. Others leave us in a state of deep focus and creativity (a state of Flow as psychologists like to call it).
Wouldn't it be handy if you knew exactly which of your ultradian peaks tended to be those you could rely on to get your best work done?
Calculating Your Prime Time
Once you have used the following spreadsheet to calculate your most productive time of day (those ultradian peaks that peak higher than the rest), you should aim to use that time especially carefully.
This is the time of day that you will be at your most focused, and most creative. This is when you'll be able to produce your best work. So tackle the less demanding tasks outside your prime time, while during your prime time, remove distractions and concentrate on your most important work.
Points to Note
Before we get into the meat and potatoes of tracking your prime time, you should keep the following in mind.
- Ideally track your productivity on this spreadsheet for at least 1–3 weeks. The more data points you have, the more reliable your results will be.
- While tracking your productivity for the first time, stick to your normal routine. You can play around with your routine later, if you wish.
- If you have a loose routine, track your productivity for at least 5 weeks so you have enough data points to find reliable patterns.
- This spreadsheet tracks the bare minimum to figure out your prime time. You should also consider keeping a journal of the major tasks you perform each day, along with a couple of other variables that you think will add extra insight to your results (i.e. when you drink coffee, or how well you slept).
Using The Spreadsheet
The spreadsheet we're going to use to track your prime time is inspired by the one used by Chris Bailey in which he tracked Energy, Focus, and Motivation. Unfortunately, he didn't share the spreadsheet he created, so I've created and shared one for you, which also tracks Creativity.
You can track more variables (or rename the variables in the spreadsheet) if you wish, but be prepared to track each of these variables during every waking hour. Don't make it too daunting for yourself.
First of all, you can download the Prime Time Calculator Spreadsheet I've created here (Excel). Feel free to create your own if you'd like additional functionality, or if you want to use the spreadsheet in another program.
Alternatively, you could use apps like Toggl, Loggr, or Track & Share to track this information, too.
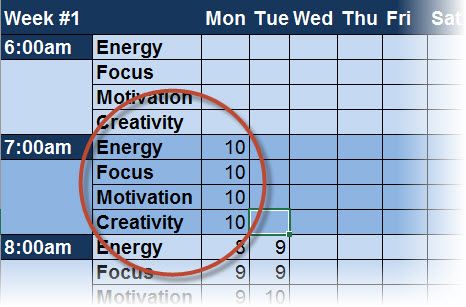
Using the spreadsheet should be fairly intuitive. From the moment you either wake up, or start working (it's up to you), start tracking your Energy, Focus, Motivation, and Creativity on the hour, every hour. Set an alarm to remind yourself to do this. It should only take around 20–30 seconds per hour.
If you decide to only track from 9am, you can leave the entries before 9am blank. The same goes if you stop tracking at 5pm. That being said, do try to only track during the same times each day, otherwise the data could be skewed.
All you have to do is score how you're feeling in each area out of 10. Be completely honest with yourself here, and don't fall victim to the Hawthorne Effect where you may feel tempted to increase your scores just to make yourself feel better.
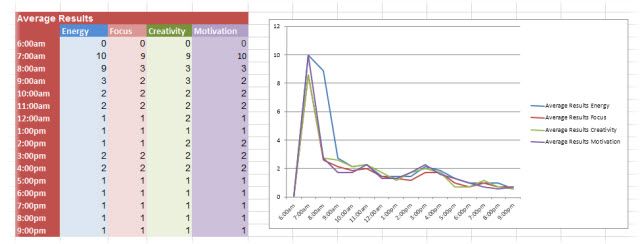
As you start inputting data, you'll see the Totals and Average column will fill automatically. As will their respective tables and graphs on the right hand side. You don't need to touch these.
If you wish to track just 5 days instead of 7, you will have to change the formula in the Average column to divide by 5, instead of 7.
Understanding Your Data
This spreadsheet will only track the absolute basics needed to understand your most productive times. This makes it easier to understand the data without getting into rocket science. Even after just two days, I could start to see patterns in my productivity cycles.
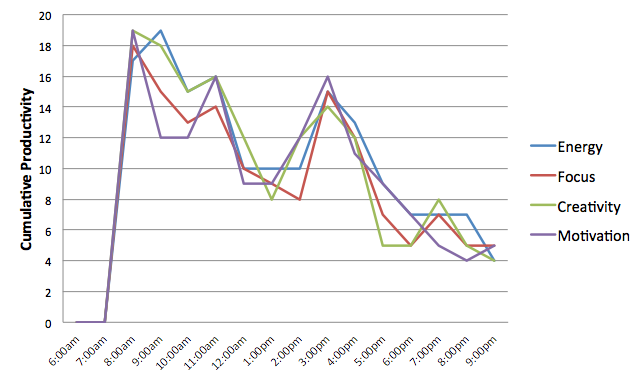
From waking up between 7am and 8am, my energy levels quickly spiked, gradually dipping between 11am and 1pm. At around 3pm those levels peaked again for a couple of hours (perhaps the energy from my lunch kicks in around then), before giving in after 5pm.
Obviously, the longer you track your productivity, the more reliable your insights will be.
Taking Things Further
Once you've figured out your current peak times, you would want to take things further. Before you do this though, be sure to carefully review the data you've collected so far.
If, as recommended earlier, you kept a daily journal, you should look out for any obvious patterns. Perhaps a bad night's sleep affects your productivity more than you think. Maybe your productivity crashes after a long meeting. Maybe your peak productivity happens when you're out of the office.
Similarly, you could use an app such as Moves (iOS, Android), which automatically records things such as steps taken and location. These data points are recorded without any input needed from yourself, so it's an incredibly easy way to gather some additional data to play around with.
Any insights you garner from your data will reveal how your productivity levels change based on time of day, routines, etc. Once you have this insight, try tracking your productivity again after making one change (try to only change one variable at a time so you can more accurately measure its impact on your productivity). As a few examples:
- Try abstaining from caffeine for at least a couple of weeks to see if this helps to prolong your peak hours.
- Wake up an hour earlier to see how this affects your productivity throughout the day.
- Spend the first 15 minutes of each day meditating, and see if this alters your levels of motivation.
- Try to find out if exercise affects your creativity by going to the gym more often.
- See if you have more peak hours while adopting the Pomodoro productivity technique, or Time Blocking.
The variables you choose to alter are countless. Have fun with it!
Start Your Life Experiment
Download the Prime Time Calculator Spreadsheet here (if you don't want to scroll up).
Track your own productivity for a few weeks to find your own periods of peak productivity; that is the first step to organize your days around your energy.
Please leave a comment to let us know what you learn from tracking your productivity. And if you'd like any extra functionality added to the spreadsheet, let me know, and I should get around to updating the spreadsheet in due course.
Image Credits: cheerful businessman by ra2studio via Shutterstock, Mathematics *Explore April 24, 2013 #4* (at one time) by Tom Brown (Flickr)


