When you think of a good time, what's the first thing that comes to mind? Probably not a flowchart? Well, give me five minutes and I'll change that.
Anyone who knows me well knows that I love Flowcharts. I love using them for the usual things like laying the logical flow of a program or the operation of some complex computer system. However, there's so much more that flowcharts can do for you. They help you to take concepts that seem very abstract and disorganized, and sort them out into very clearly defined paths of logic that take you from where you are now, to where you want to be.
If you've been reading MakeUseOf, then you've probably come across one or two mind map applications. For example, there's MindMup for Google Drive that Angela covered before, Saikat discussed how to build a mind map in Microsoft Word, and Umar reviewed MyndBook for building mind maps online. When you boil it down, a mind map is really little more than a flow chart that flows from a center node outward. It's a one way to organize the flow of a process or of information, but it's certainly not the only way.
In this article, I'm going to review five examples of some other flowchart formats you can use, depending on the project you're working on, or what you want to use the flowchart for. I guarantee that when you're through reading here, you'll likely have thought of a few useful ways that you could use flowcharts to organize your own life or your workflow.
Cause and Effect Flowcharts
One of my favorite flowcharts is cause-and-effect. It lets you sort of put together a pros and cons argument flow - sort of like planning out the next ten chess moves of your life and trying to figure out what'll mostly likely happen depending on your choices.
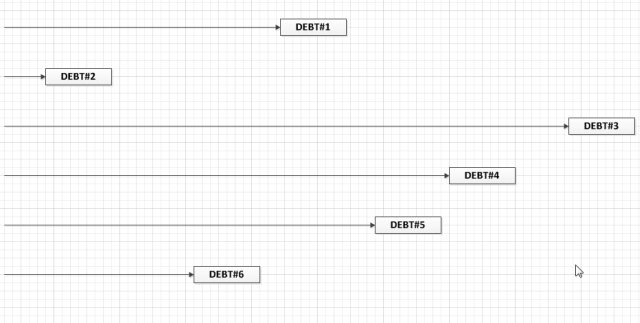
You may wonder how such a thing could be practical, but you can actually use such a flowchart to detail how your finances will play out. Not long ago, I wrote about using Excel to manage your debt. The technique I detailed there was something I called the "snowball-effect". Without using this debt-payoff technique, your debt payoff over time looks something like the flowchart below.
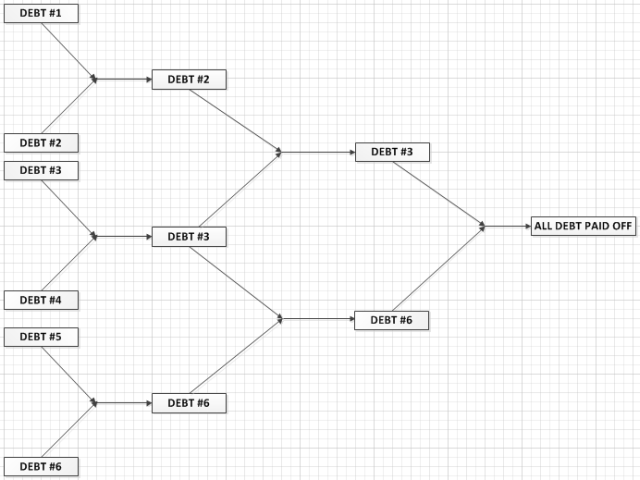
That is, six distinct debts with a fixed monthly payment all having their own defined payoff periods independent of one another. They each basically take as long to pay off as the minimum payment will manage. However, using a cause-and-effect flowchart, you can detail just how powerful the "snowball" approach is - that is, once a debt is paid off, taking the minimum payment of that one and applying it (adding it) to the minimum payment of a second debt. This is what that new flowchart looks like.
Why use a flowchart to plan this out? Well, it organizes the data in a much smaller space. For example, replacing "Debt #1" above with the name of the debtor and the amount of debt owed lets you store this information in one place. If you want to make the flowchart even more accurate, you can use the Excel sheet example I linked to above to calculate how long it'll take each debt to be paid, and draw the length of its line in the flowchart accordingly. This would give you a graphical representation of the real payoff flow for all of your debts.
If you do this, you'll see just how dramatically shorter the second flowchart is - meaning how much faster your debt will get paid off.
Organizing Your Work Space
In the manufacturing industry, we have a term called "lean manufacturing", which means cutting as much waste as possible out of a manufacturing process. Waste can be how many steps you take from one workstation to the next, how many times you have to go back and forth to get tools, and so forth.
Using a room flowchart allows you to do things like simplify any kind of task you're doing in any workspace. Are you a cook working in a kitchen and want to shorten how long it takes you to make certain foods that you make often? Using this flowchart will help you figure out where to place the right tools and how to organize your kitchen to make things go faster. If you're an IT technician and you have to do a lot of repetitive tasks like swapping out tape backups, or shipping out electronics that often need repair work, a work space flowchart can streamline how long it takes you to get your job done.
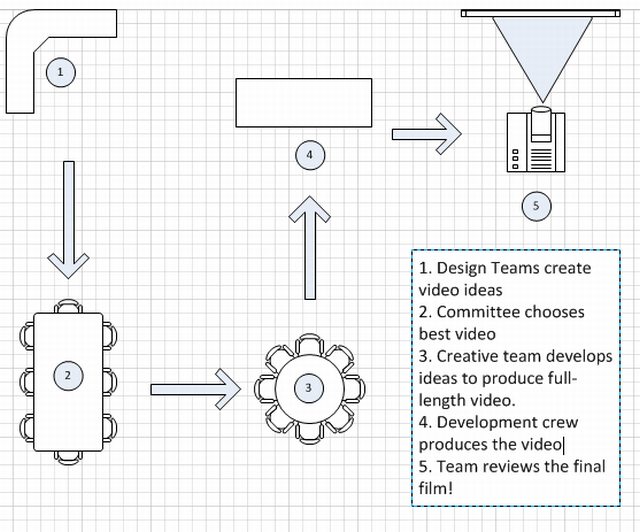
In the example above, it shows how a work space flowchart was used to detail the workflow of the production of an independent film. It starts from the cubicle (representing the design team), then flows into the board room where a committee chooses from the best ideas. From there it moves to the creative team, then to the development crew who make all of the ideas into reality, and then finally it's showtime.
Sometimes this may be nothing more than showing a workflow using symbols, but if you can redesign an office area so that the creative team sits in a location closer to the development crew, then obviously it'll be easier for them to collaborate and get their work done more efficiently.
Laying Out Life Goals
It wasn't long ago that I wrote about using Excel for goals management. If you want to work out your plan for your overall life in a more graphical way, then a flowchart is the way to go.
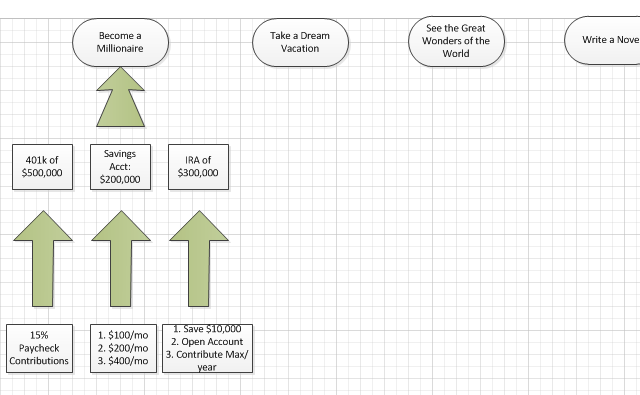
To use a flowchart for planning out your life goals, start by creating a top row of big-goal "bubbles" representing the 5 or 6 major life goals that you want to accomplish before you die. This could be writing a great novel, traveling the world, becoming a millionaire - whatever.
Now, work backwards. Reverse engineer those dreams. What do you have to do to become a millionaire? Well, you'll need several accounts that have reached a certain dollar goal by the time you retire.
What do you have to do to accomplish those individual goals from now until retirement? Well, you may need to save 15% of your paycheck to your 401k at work. You may need to be disciplined about saving a certain amount of money into your savings account. A flowchart can help you lay out the road map to your goals, and by working backwards from the big goals to the smaller tasks, you can eventually boil those big goals down to the everyday tasks you need to do to achieve those dreams.
Keep Records of Your Home Technology
How many electronic devices do you have in your home? The average home today has 2-4 smartphone devices, maybe a few tablets, several computers, a smart TV, a wireless printer, and more. These days, a family needs its own IT pro just to keep it all running, and when things go wrong, do you know the MAC address or the warranty information for those devices? Do you even know what all the devices are?
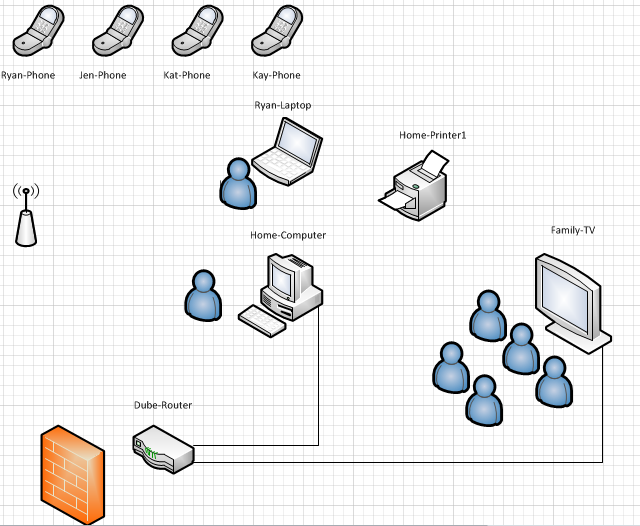
Using a network flowchart, you can map an inventory of all of the devices in the home, as well as how they connect to your network. In the diagram below, I've got mostly wireless devices in the home, plus two devices that are hard-wired to the router.
Why use a graphical diagram to track these things? Well, not only can you also label each device with the MAC address, device network name and warranty info, you can also lay out the diagram in such a way that it generally shows where those devices can be found in the house. Having the MAC address and device name details can really help with troubleshooting when you're logged into the wireless router.
Organizing Complicated Projects
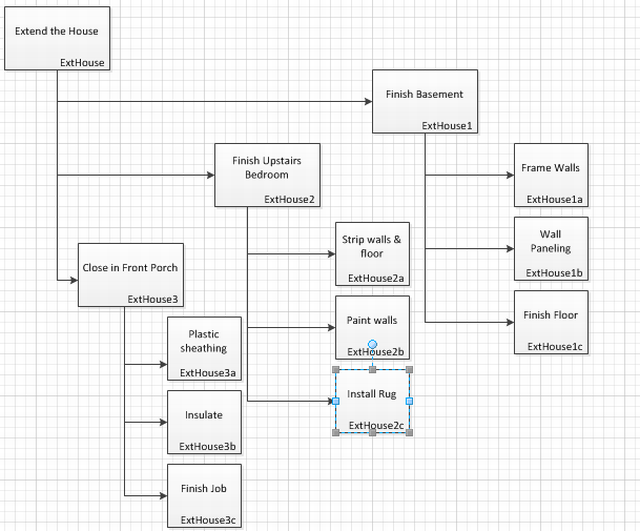
Obviously, we've shown you many times on MakeUseOf how effective a diagramming tool is when it comes to laying out and organizing really large, complex projects. This is actually where the "mindmap" format works best. That is, starting with one central "node" as the final goal of your project, and then branching out from that goal into the many different sub-goals that are going to get you there. The example below is how you might use a flowchart to organize a project to extend the size of your house.
The project includes three sub-goals - finishing the basement, finishing the front porch and extending the upstairs bedroom. Those three goals are then broken down into their individual pieces. There are few tools more effective than a flowchart to organize really huge projects in a way that anyone can understand at a glimpse.
Why Flowcharts are So Powerful
The human mind really works well at understanding complex things in a more visual format. You could write a 4- or 5-paragraph email to someone, trying to explain the layout of some huge project, or you can send them a one page flowchart that shows every detail of the project in a way that's easy to follow and understand.
So, how do you use flowcharts in your life or at your job? Have you ever used them for more creative and unique purposes? Share some of your wacky flowchart ideas in the comments section below!

