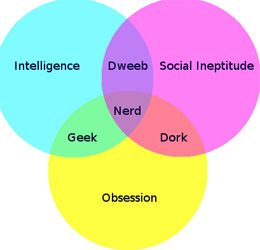
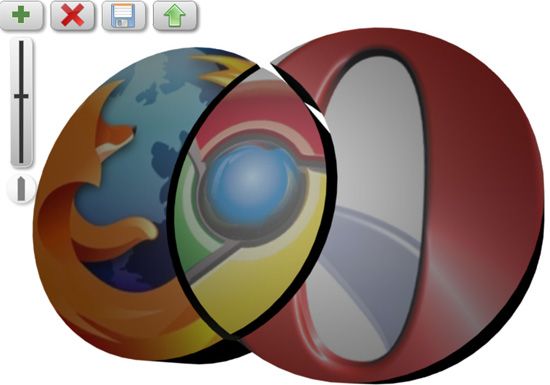
A venn diagram is a type of information graphics (infographics) which is built of two or more circles with some overlapping areas. A venn diagram visualizes relationships between the sets of data or ideas: overlapping circles show those features which are common to two or more concepts.
In terms of visually-appealing elements and details, the venn diagram is the weakest example but this doesn't mean it is the least informative. In fact, I find venn diagrams the most thought-provoking and discussion-encouraging form of data visualization.
There are plenty of cool venn diagrams online but did you know that you could easily generate one of your own and that would take you no more than a couple of seconds? Here are the three tools that can help you do that!
1. Google Suggest Venn Diagram
I have already listed some fun ways to visualize Google Suggest results and this one should have definitely made the list. Google Suggest Venn Diagram Generator is a simply genius tool which works as follows:
- Give it a question or a phrase;
- Use X as the placeholder for your terms;
- Give it three terms (preferably in one vertical);
- Let the tool generate three sets of Google Suggest results (based on your settings above);
- If any results overlap, you'll see it in a venn diagram.
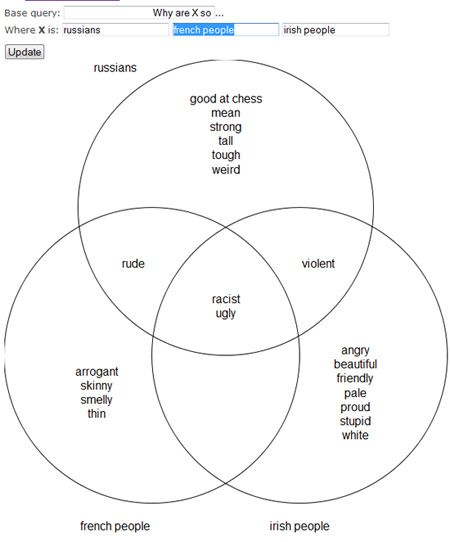
Example 1:
Why are X so... (to replace X I typed: Russians, French people and Irish people - with no particular reason behind the choice; these were the first that came to mind):
Result:
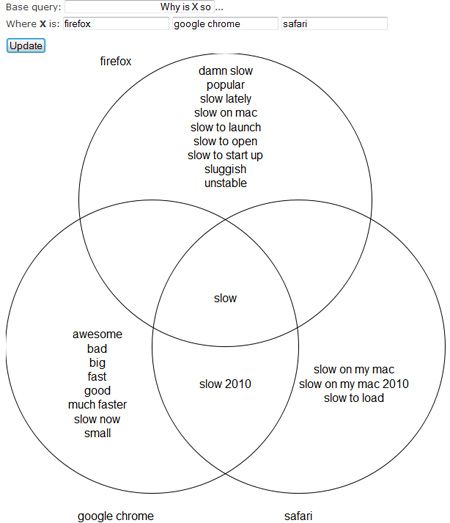
Example 2:
Why is X so... (to replace X I typed: FireFox, Google Chrome and Safari):
Result:
Hacker News has even more examples...
Note: Here's another Google-Suggest-powered venn diagram that can be fun to play with.
2. Twitter Venn
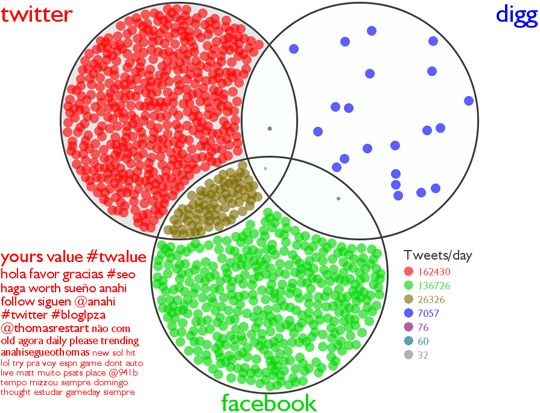
Twitter Venn is an interactive Venn Diagram generator that uses Twitter Search data. Ryan has already mentioned the tool in his post titled "4 Awesome Free Tools to Visualize & Analyze Twitter"
It works as follows:
- Give it three search terms
- The tool goes to Twitter to search for each of them
- The tool generates a venn diagram where each dot represents a tweet
- Tweets that contain two or more search terms will be placed within the corresponding intersections
- Hover the mouse over any dot to read the corresponding tweet message.
The tool may thus turn particularly useful for:
- Researching the relationships between the terms and trends;
- Finding Twitter conversations relating to two or three topics.
3. 3D Photo Venn Diagram
Make Sweet is a fun free online tool that allows you to quickly create a venn diagram using photos. The resulting venn diagram has an appealing 3D effect.
Unlike the above two, this one:
- Has only two overlapping circles;
- Allows you to control what are in the circles and what lies between;
- Supports pictures (as well as words).
All in all, the tool may help you in brainstorming. Besides, it should be cool to use to create neat viral images to visualize your point or decorate your blog post:
Of course, if you are not bad at Photoshop, you are more likely to be able to create something similar on your own, but this one would be much quicker and easier.
Are you aware of any other cool Venn diagram tools? Please share them in the comments!
Image via buzzfeed

