If you are a busy person that doesn't really have a whole lot of time to check the news every day, but you like to keep up to date with the latest major events like major storms, the stock market or major changes throughout the world, a graphical display is much more efficient.
You've probably seen examples of some stock broker offices where there's a monitor with lots of charts, graphs and other graphics all displaying data in real-time. Or maybe you might have seen those cool NASA launch center displays with all sorts of important data scrolling across the screen.
In my opinion, that's the best way to show a lot of information in a small space. And if you're working with two or three screens like I am, then you have the monitor space to have a display up all the time - where you can check out what's going on throughout the world with just a glance.
In this article, I'm going to walk you through my efforts to put together that sort of display using very simple web-design tools and techniques. I'm also going to share 15 of the best online dashboard widgets that I found throughout the Internet that helped to build this large informational display of world information.
Building a Real-Time Display Of World Data
One of the first places that I went to in order to build such an informational display is Netvibes. We've covered the site often, such as in Angela's awesome article on how to use it to manage your life.
I really like Netvibes too, and after reading Angela's article, I actually started using it to organize links and tools for each of the major tasks that I have to do online. It's nice to have everything in one place. However, when I tried using the HTML gadget to embed widgets into the page, I noticed that it doesn't work very well. You can resize the width, but the height seems to remain fixed - cutting off larger widgets.
After trying a few other sites - Protopage was another that didn't quite work right. It added too much space on the sides of the widgets, and didn't allow proper resizing. So, after spending too much time trying to make preexisting pages work, I decided to turn to designing a page from scratch.
I wanted to come up with a solution that anyone could do, regardless of web-design experience. My WYSIWYG web design tool of choice is Kompozer. The only drawback with this approach is that it uses tables, which in the world of web designers is considered archaic compared to using CSS. But for simplicity sake, we're going to use Kompozer and lay out the widgets right on the page.
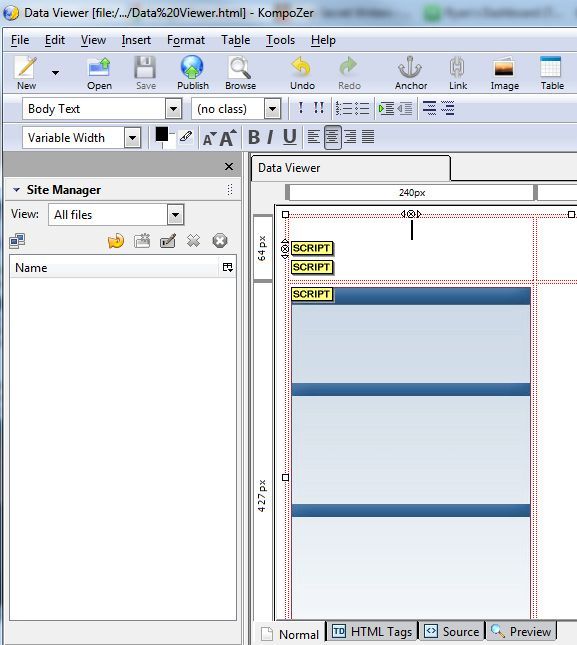
Here's how the design view in Kompozer looks after you've inserted a table - in this case I use a 4 by 4 table, but you can make it any size you want.
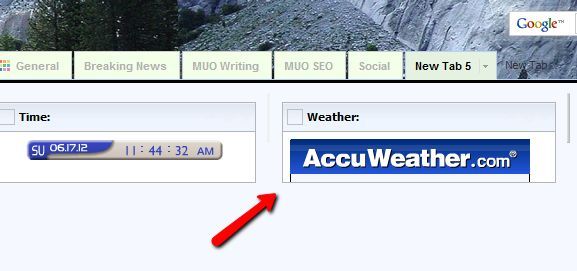
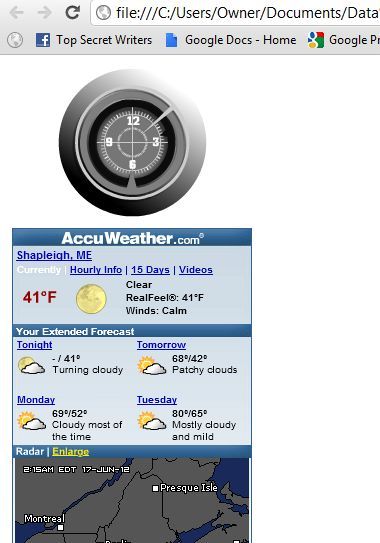
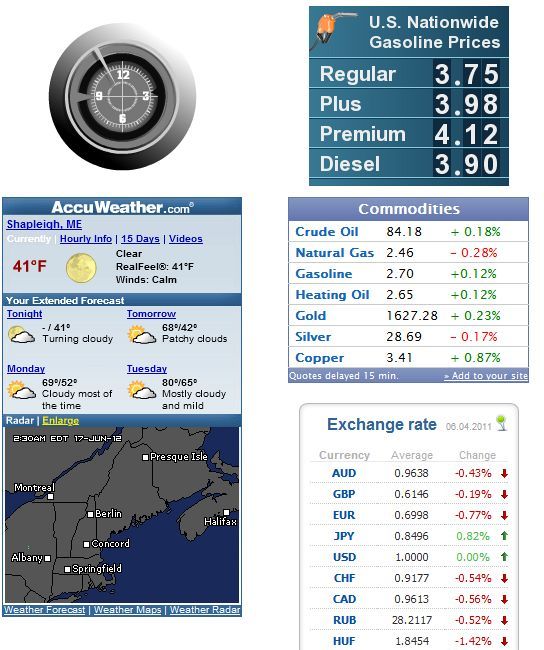
First, right click on the table and change the properties so that the lines are no color (invisible). The first widget I inserted into the upper left cell was a cool clock widget from clocklink.com. Under that, I added a weather widget from Accuweather.com - one of my favorites because it shows a cool graphical radar display of any approaching storms.
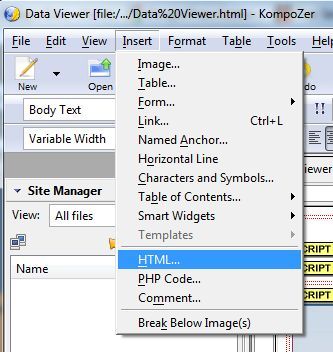
In each case, I simply click inside the cell that I want to insert widget code, then click the Insert menu and choose HTML. Just paste the widget code into the window that pops up.
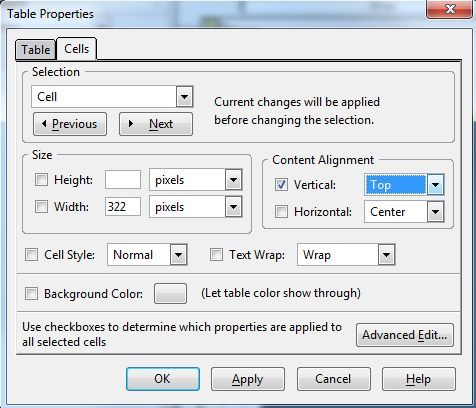
You may notice your widget isn't centered, or it shows up too far down from the top of the cell. That's easy to fix in Kompozer without any coding knowledge at all. Just right click on the cell, choose table cell properties, and then change the content alignment to whatever looks best.
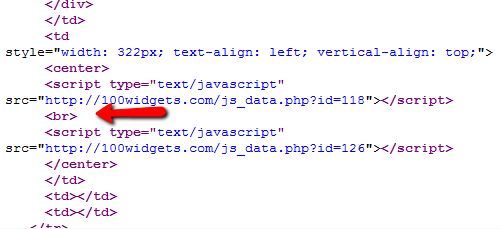
To test your changes, just save the file to your local computer as an HTML file, and then view the file using your favorite browser. If you're really having problems, you can always insert code if you really have to. In Kompozer, you can edit the page by clicking on the "source" tab. For example, there were a couple of cases where I just had to insert a break <br> to force a space between some of the widgets that I placed inside the same cell.
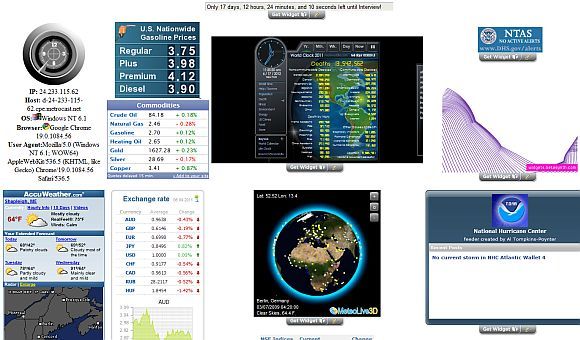
Adding three more of the best widgets I found I'd developed the realtime informational display shown below. The three cool widgets I added were the Gas Prices widget from gas-cost.net, and the commodities widget and current exchange rates widgets from 100widgets.com.
These are all realtime widgets, displaying current data from all around the world. Now I've got up-to-the second data on prices, stock rates and weather, all with a single glance. But only half the web page is filled, and we've got a lot more information to build onto this page - two more entire columns of data to be exact.
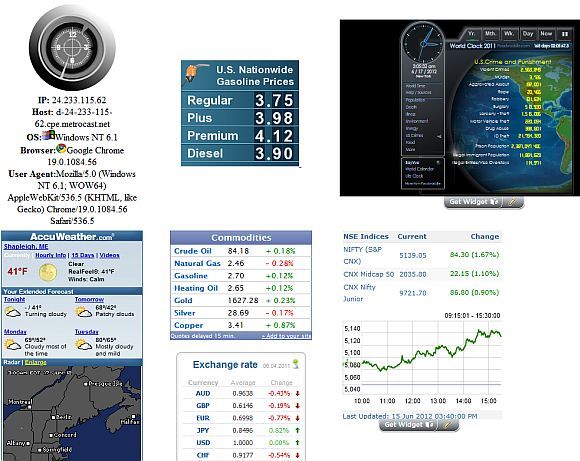
Another really cool widget that I added to the page was the user's configuration widget [No Longer Available] from 100widgets.com. This gives you feedback as to your current IP address, computer info and windows/browser version. This is helpful when you're on the road and connecting to your page from a hotel or library and need to know your current IP. I also added the very cool World Counters and the stock indices from widgetbox.com.
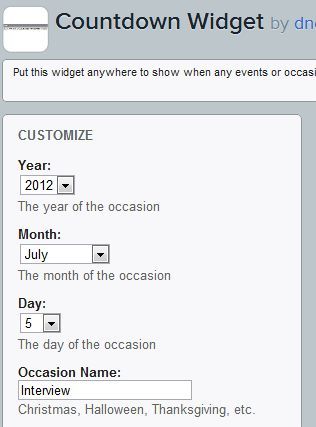
A couple of other useful widgets that are worth mentioning for this kind of full-page realtime display - the first is a countdown widget from widgetbox.com. When you set it up, you give it a date and event to count down to, and it shows up in the widget as a text countdown toward that event (see the large display shown two images down from here).
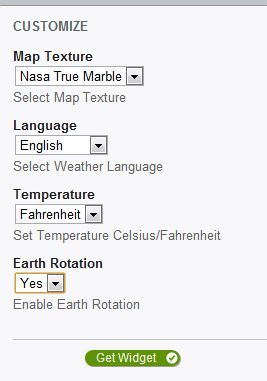
And no sci-fi looking data display would be complete without a rotated graphic of the earth displaying realtime temperature information from any point on the planet that you like. You can get that data from the Weather-3D widget from Widgetbox.com.
In the image below of my full-page real-time data dashboard, you can see the countdown at the very top of the page (I inserted it centered before the table itself), and the 3d Weather globe just below the world countdown widget. In the last column of the table I added the current DHS threat level, sexy curves (more for decoration than anything else - it looks cool), and finally the real-time alert widget from the National Hurricane Center.
With the page finally completed, I now have access to the current time, local and global weather, stock market information, current gas prices, current hurricane alerts, national threat levels and of course the loads of world data in the world countdown widget.
You can tweak this sort of display with whatever information you want by searching for other informational widgets on any of the major widget sites, and then inserting them into your layout wherever you like. Kompozer's ability to easily center and align cells will allow you to make the entire display look clean and really cool. Once you're done, you can just upload the HTML file to your own web host so that you can access it from anywhere in the world.
Create your own informational dashboard and let us know how it goes. What other useful widgets did you discover for realtime information? Share them in the comments area below - I'd love to see what other cool widgets people found!
Image Credit: Telecommunications Graphic Via Shutterstock


